
Journal of Cardiobiology
Download PDF
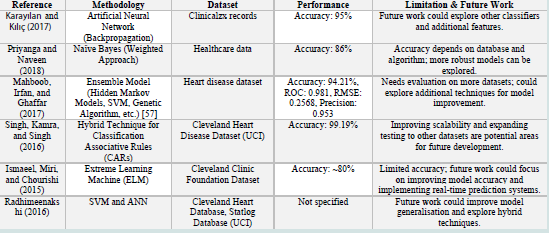 Figure 1:Summary of previous study based on Heart Disease Prediction using machine learning techniques
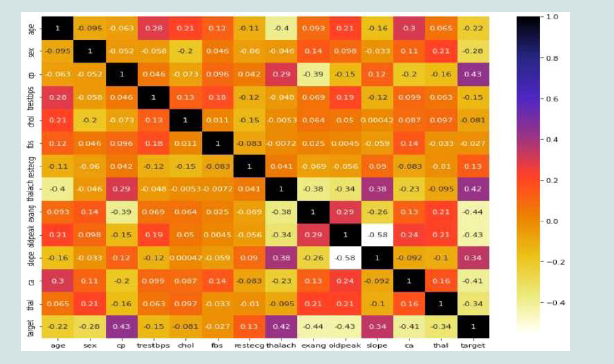 Figure 2:Correlation Matrix of clinical records
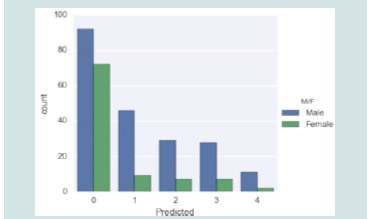 Figure 3:Disease rate in the male and the female.
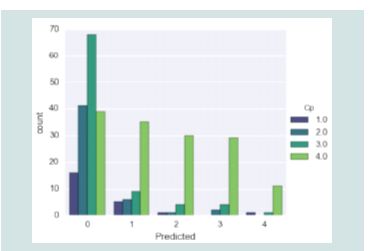 Figure 4:Disease prediction according to chest pain type
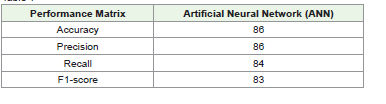 Table 1
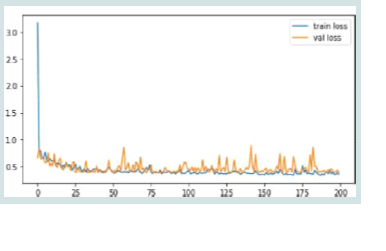 Figure 5:Performance of Artificial Neural Network
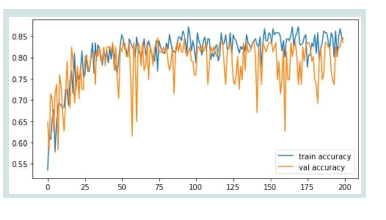 Figure 6:Training and Testing Loss for ANN model.
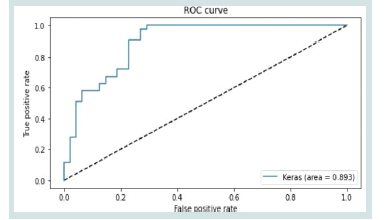 Figure 7: Training and Testing Accuracy for ANN model.
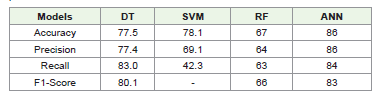 Table 2:Comparative analysis for Heart Disease Prediction between the model’s
performance
Table 2:Comparative analysis for Heart Disease Prediction between the model’s
performance
Research Article
Evaluating the Effectiveness of Machine Learning for Heart Disease Prediction in Healthcare Sector
Krishna Madhav Jha*, Vasu Velaga, KishanKumar, Routhu, Gangadhar Sadaram, Suneel Babu Boppana and Niharika Katnapally
1Topbuild Corp, Sr Business Analyst
2Cintas Corporation, SAP Functional Analyst
3ADP, Senior Solution Architect
4Bank of America, VP DevOps/ OpenShift Admin Engineer
5iSite Technologies, Project Manager
6Pyramid Consulting, Tableau Developer
2Cintas Corporation, SAP Functional Analyst
3ADP, Senior Solution Architect
4Bank of America, VP DevOps/ OpenShift Admin Engineer
5iSite Technologies, Project Manager
6Pyramid Consulting, Tableau Developer
*Address for Correspondence: Krishna Madhav Jha, Topbuild Corp, Sr Business Analyst.
E-mail Id: krishna22883@gmail.com
Submission: 02 January, 2025
Accepted: 29 January, 2025
Published: 31 January, 2025
Copyright: © 2025 Jha KM, et al. This is an open access article
distributed under the Creative Commons Attribution License, which permits
unrestricted use, distribution, and reproduction in any medium, provided the
original work is properly cited.
Keywords: Heart Disease Prediction; Healthcare Sector; Predictive
Models; Cardiovascular Disease; Machine Learning; Genetic
algorithm-support vector machine (GA-SVM); K-Nearest Neighbors
(KNN); Root Mean Square Error (RMSE); Artificial Neural Network
(ANN); Random Forest (RF); Decision Tree (DT); Receiver-operating
characteristics curve (ROC)
Abstract
Heart disease is still one of the world’s top causes of mortality.
Thus, prevention and effective treatment depend on early detection.
This study uses the Cleveland Heart Disease Dataset to examine how
ML techniques can be used in the prediction of heart disease. By
removing outliers, encoding categorical data, handling missing values,
and scaling features, the dataset was prepared for further processing.
There was an 80:20 split between the data sets used for training and
testing. Data was collected and used to train and assess a number
of classification models. These models included DT, SVM, RF, and
ANN. In comparison to the other models, the ANN performed quite
well, achieving 86% accuracy, 86% precision,84% recall, and 83%F1-
score. In contrast, DT, SVM, and RF showed lower performance across
all metrics, with ANN proving to be the most reliable for heart disease
prediction. The study concludes that ANN offers the highest predictive
capability, making it a promising tool for early heart disease detection.
Future research could explore the incorporation of additional features,
such as lifestyle factors or genetic data, to enhance model accuracy.
Introduction
Mining the massive amounts of healthcare data collected by the
industry can reveal previously unknown insights that might inform
better decision-making. Heart disease patient mortality rates continue
to rise globally, and healthcare providers have access to massive
amounts of patient data. Thus, researchers have begun applying data
mining techniques to aid in a diagnosis of heart disease[1].
A term “heart disease” encompasses a wide range of medical
issues that impact the cardiovascular system and the heart specifically.
The signs and symptoms of cardiovascular disease can differ from one
kind of disease to another. An issue with the structure or function
of the heart as a result of aberrant prenatal cardiac development is
known as congenital heart disease. When blood supply to the body’s
organs is inadequate, a condition known as congestive heart failure
sets place [2]. Coronary heart disease, another name for ischaemic
heart disease, is the main reason people experience heart difficulties
all around the world. Atherosclerosis, in which fatty deposits
accumulate inside the blood arteries that provide blood to the heart
and subsequently constrict those vessels, reduces blood flow to the
heart muscle and is a hallmark of coronary heart disease.
Using clinical data from patients, medical professionals can
profit from a system that predicts the likelihood of cardiac disease
[3]. Therefore, it is possible to increase a likelihood that patients will
be diagnosed with heart disease by creating a system that uses data
mining techniques and then undertaking data mining on numerous
parameters related to heart disease.
Machine learning allows us to uncover valuable patterns
and insights inside them. Among machine learning’s numerous
applications, illness prediction stands out in the medical industry
[4]. Numerous researchers were intrigued by the possibility that
ML could enhance the precision, timeliness, and effectiveness of
medical diagnosis. Machine learning techniques have many potential
applications in medicine, while the focus of this discussion will be on
cardiac illness diagnosis. The best way to save lives is to detect heart
disease early on, since it is the leading cause of mortality globally[5].
It is right; but post mortem overdiagnosis of cardiovascular disease in
unclear cases leads to bias in mortality statistics. The lower diagnostic
quality, the higher percentage of ischemic or atherosclerotic heart
disease among causes of death [56]
Motivation and Contribution of the Study:
The motivation behind this study stems from the growing need to
optimise heart disease prediction and early diagnosis using advanced
technologies, given the alarming rates of heart-related health issues
globally. Traditional diagnostic methods often fall short according
to scalability and accuracy, especially when it comes to handling
complex and vast datasets that characterise modern healthcare.
With the rise of big data in healthcare, it has become crucial to
explore innovative approaches that integrate ML and AI to enhance
prediction capabilities and outcomes. The following are the primary
benefits of this research:
Collection of Cleveland Heart Disease dataset for Heart Disease
Prediction in the Healthcare Sector with a focus on accuracy and
reliability.
Preprocessing steps, like normalisation, data cleaning, and feature
selection, are implemented to ensure data integrity and prepare the
dataset for accurate model training.
Implement and compare Several ML models, including SVM,
DT, ANN, and RF, are developed and compared to decide a most
effective approach for heart disease classification.
Models are evaluated employing different metrics like F1-score,
recall, accuracy, precision, and AUC-ROC to ensure robust and
reliable results for early heart disease prediction.
Structure of paper:
This paper is organised in the following way: An earlier healthcare
study, in the context of diagnosing cardiac disease, is presented in
Section II. Methodology, including dataset, preprocessing, and
machine learning model details, are detailed in Section III. The
experimental results, including an examination of the AI models’
performance, are presented in Section IV. Section V wraps up the
study and looks at where it might go from here in terms of future
research.
Literature Review
This section of the research summarises previous work that has
addressed the topic of healthcare-related heart disease prediction
through categorisation and detection. Classification methods were
the primary emphasis of the literature studied. Some reviews are:
In this study, Karayılan and Kılıç (2017) a backpropagation
algorithm for artificial neural networks is suggested as a means of
predicting the occurrence of cardiac diseases. With thirteen clinical
criteria given into a neural network that was trained using the
backpropagation approach, the presence or absence of heart disease
could be determined with a 95% accuracy rate [6].
In this research work, Priyanga and Naveen (2018) an analysis
is conducted on a smart and efficient system that predicts the
occurrence of heart disease using the NB modelling technique. When
using a web-based application, users must fill out the necessary fields
with the appropriate values. Connecting the dots between the user
input value and the trained data, the data is retrieved from a database.
While current methods fall short in detecting cardiac illness, this
study should help clinicians make better decisions. This approach
uses Naïve Bayes for the goal of classifying output data as either very
high, low, average, or no heart disease at all. This necessitates the
execution of two fundamental tasks: categorisation and prediction.
The database and algorithm utilised determine the system’s accuracy,
which is 86% when using the Naïve Bayes Weighted Approach
(NBwa)[7].
This study, Mahboob, Irfan and Ghaffar (2017) focus on a variety of
ML techniques that aid in a detection and identification of numerous
cardiac disorders. This article discusses a wide variety of ML methods,
including SVM, GA, prediction systems, data mining techniques,
computational intelligence classifiers, feature selection, and hidden
Markov models. They were able to choose the most appropriate
method by carefully examining all of them. As a result, they are
able to suggest an Ensemble Model that accurately classifies various
cardiac illnesses by utilising relevant process learning algorithms.
Recent technological developments have allowed for an analysis of
a proposed method. Compared to the performance of KNN, ANNs,
and SVM algorithms, the proposed method significantly outperforms
them with a precision of 0.953, a RMSE of 0.2568, and a ROC of 0.981.
Using the ROC, they analysed and evaluated the algorithms that were
implemented and the Ensemble Model that was proposed [8].
This study, Singh, Kamra and Singh (2016) is for the purpose
of predicting cardiac illnesses. A heart disease forecasting system is
developed employing a best results to obtain a prediction accuracy
of 99.19% using the hybrid technique for categorisation associative
rules (CARs). After put various data mining techniques to a test, the
study is implemented using a Cleveland heart disorders dataset by an
UCI machine learning library. Gender, age, kind of chest discomfort,
blood pressure, blood sugar, and other factors are associated with the
causes of cardiac disorders and can be used to forecast the onset of
early symptoms cardiac condition[9]. AI technology may improve
clinical care, education and training. However, clear regulation
and understanding by clinicians are needed. ML is a subfield of AI
creating systems that can improve predictions and decisions by
exposure to data, thereby imitating human learning [52,53]. ML
models in combination with other data iprove prediction quality of
coronary artery disease [54]. Problems such as model generalization,
bias, transparency, interpretability, accountability, and data privacy
remain barriers for broad adoption AI in cardiology [55].
In this study, Ismaeel, Miri and Chourishi (2015) to represent
these elements, an ELM framework is employed. An expensive annual
physical can be supplanted by the proposed system, which would
alert patients to the likely existence of heart disease. The Cleveland
Clinic Foundation has acquired the data used to construct the system,
which includes information on approximately 300 patients. This
architecture has an accuracy rate of approximately 80% in predicting
cardiac problems, according to simulation studies [10].
This study, Radhimeenakshi (2016) presents a medical decision support
framework for the rapid, accurate, purposeful, and sane
characterisation of cardiac illness. Both the Statlog Database and
the Cleveland Heart Database, which are part of the UCI ML dataset
vault, were used in this analysis. A proposed system model uses a
SVM and an ANN to categorise the data records. Evaluate how well
each dataset performed as well [11].
Methodology
The following steps of research design are shown in [Figure 1]
flowchart. This flowchart outlines a ML pipeline for heart disease
classification using the Cleveland Heart Disease Dataset, comprising
303 instances and 76 attributes, was used, with 14 key attributes
selected based on their relevance to heart disease prediction, including
age, sex, chest pain type, cholesterol, resting blood pressure, and
maximum heart rate. It begins with data preprocessing, including
handling missing values, outlier removal, data encoding, and feature
scaling. After feature extraction, the data is split into training and
testing sets. The splitting ratio is 80:20. Multiple classification
models—DT, SVM, RF, and ANN—are trained and evaluated. The
outcomes show which model is best for forecasting cardiac problems
based on performance measures like F1-score, precision, recall, and
accuracy.
Flowchart for Heart Disease Prediction:
An overall step of the flowchart for Heart Disease Prediction are
provided below:
Data collection:
In this study, use the Cleveland Heart Disease dataset for Heart
Disease Prediction in the Healthcare Sector. The current research
makes use of data collection that includes 303 instances and 76
attributes in total. Most studies, however, limit themselves to no more
than 14 characteristics because of the strong correlation between
them and cardiovascular disease. This includes the following features
in that order: age, sex, kind of chest pain, resting BP, cholesterol,
fasting blood sugar, resting ECG, maximum heart rate, exercise induced
angina, old peak, slope, number of coloured vessels, and
thalassaemia. Some of the visualisations are as follows:
[Figure 2] shows that there are a total of fourteen attributes in the
dataset, with eight of those being numerical and six being categorical
Characteristics and the values of their aspects. The patient’s resting
blood pressure is abbreviated as TRESTB PS. FBS is a blood sugar
meter. CHOL stands for cholesterol level. The results of resting
electrocardiograms are measured using RESTECG. In order to
interpret the findings of the resting electrocardiograms, THALACH
shows the maximal heart rate of the subject. Exercise-induced angina,
or EXANG, is a medical term.
[Figure 3] shows the distribution of predicted values for a model
that predicts the sex of a person. The predicted value is shown on
the x-axis, while the count of predictions is displays on a y-axis. The
number of male forecasts is shown by the blue bars, while the number
of female guesses is represented by the green bars. The graph shows
that the model predicts more males than females, with the highest
number of predictions at the value of 0. The model also makes some
predictions for both males and females at the values of 1, 2, and 3, but
fewer predictions at the value of 4.
[Figure 4] shows the distribution of the predicted values of a
variable (on the x-axis) based on different categories of a categorical
variable (on the y-axis). The bars are grouped according to the
categories of the categorical variable, which are represented by
different colours. The height of each bar represents the count of
observations within each group that corresponds to the predicted
value on the x-axis.
Data Pre-processing:
Processing data is getting it ready to be loaded into the algorithm.
Environmental data in its raw form is unfit for processing. Therefore,
in order to make it more intelligible, the dataset is pre-processed
[12,13]. The suggested solution consists of a few stages, one of which
is pre-processing, which involves eliminating null values, empty
arrays, and duplicate data. ML models rely on data processing to
clean, organise, and organise raw data. The following pre-processing
steps are listed below:
Handling missing values:
The rows and columns in question will be removed if 75% of the
values are lost [14]. Following data deletion, there must not be any
introduction of bias.
Remove outliers:
Outliers can skew results and lead to inaccurate models[15], so it
is crucial to analyse the dataset for these anomalies and remove them
to ensure the integrity of the analysis.
Data encoding:
After address an ordinality problem, the values of a chest pain
kind are encoded into binary values using OneHotEncder. The multiclass
dependent variable or value that needs to be predicted is present
in this dataset. From zero to four it goes.
Scaling with standard scaler:
The Standard Scaler standardises features in the Cleveland Heart
Disease Dataset to have a mean0 and a standard deviation1 [16,17].
This ensures equal contribution to model performance, improving
prediction accuracy and can be easily implemented with Scikit-learn.
The following equation of (1)
Feature Extraction:
After preprocessing Feature extraction is the act of reducing
the immense amount of raw data to a more manageable one that
is more indicative of the real signal of interest, and that performs
more easily for analysis and model performance by isolating and
selecting for the most pertinent information [18]. It Condenses the
data dimensionality, remove redundancy and picks out important
patterns or relationships specifically relevant for the task.
Data Splitting:
There was a 20% testing set and an 80% training set within the
dataset. The models were optimised and trained on the training set,
and their performance was assessed on the testing set. The test set
performance of each model was recorded.
Prediction with ANN model:
An artificial neural network (ANN) consists of three layers:
input, hidden, and output[19]. The neural network receives features
through the input layer. When the hidden layer updates the weights,
it improves the network’s performance. Finally, the output layer
gives the network’s results in terms of classes [20]. The propagation
function and learning rule determine the output of a neural network
[17]. The propagation function, which influences the inputs to the
j-thneurone by the outputs of the preceding neurones, is expressed
in Equation.
where 𝑝𝑗 (𝑡) is a propagation function, 𝑂𝑖 (𝑡) represents the
neuron’s previous output, 𝑤𝑖𝑗 is a weight and 𝑏 is bias.
The learning rule modifies the neural network’s parameters to provide an acceptable output for every input set. By modifying the network’s weights, the learning process enhances output computation in accordance with the learning rule.
Massive training and back-propagation of mistakes allow the artificial neural network’s weights to be fine-tuned, resulting in a faster learning rate [21]. Neural networks excel in interpreting the results of uncertain data sets without prior knowledge of the data sets’ evenness.
Performance Matrix:
Several evaluation measures are used to analyse the performance
of models that forecast cardiac disease; this completes the picture
of how effective the models are [22]. The confusion matrix is used
to create the assessment metrics in this study, which comprise F1-
score, recall, accuracy, and precision. Here are a component that a
confusion matrix breaks down:
True Positive (TP): The model accurately detects cardiac illness
when it really exists in the patient.
True Negative (TN): When a patient does not actually have cardiac disease, a model correctly identifies that fact.
False Positive (FP): When a patient does not actually have cardiac disease, a model wrongly labels them as having it.
False Negative (FN): A patient with heart disease is falsely classified as having no heart disease by the model.
Accuracy The percentage of cases that are accurately identified, including both true positives and true negatives, relative to the total instances, is known as accuracy. Accuracy is calculated via a following Equation (3):
Precision The percentage of positively anticipated cases that actually occurred out of all positive instances is called precision. It assesses how well the model can prevent false positives. Precision is calculated using the following Equation (4)
Recall Recall is a percentage of TP that was accurately forecasted relative to the total number of positives. Here, they check if the model can identify every single positive instance. From Equation (5), recall can be calculated, F1-Score
To create a single measure that is balanced between Precision and Recall, the F1-Score is calculated as the harmonic mean of the two. It really shines in cases where the dataset is skewed. The following Equation (6): Classification algorithms are sometimes evaluated using the area under the ROC curve (AUC). Values between 0 and 1 represent the area under the curve, while higher values indicate that the classification algorithm performs better in terms of estimation [29].
Results And Discussion
Several categorisation methods were employed in this
investigation, and their results are examined in this section. In order
to successfully detect cardiac illness, this study utilised AI approaches.
The methods like DT [13], SVM [23], RF [24], and ANN are trained on the Cleveland Heart Disease Dataset and assessed employing
a performance matrix like f1-score, recall, accuracy, and precision.
[Table 1] shows how well the suggested ANN model worked, while
[Table 2] shows the outcomes of the model comparison.
Findings ANN model performance on Heart Disease Prediction
on Cleveland Heart Disease Dataset
[Figure 5] displays a performance of an ANN. A bar chart displays the f1-score, recall, accuracy, and precision of the model. A model achieves an accuracy86%, a precision86%, a recall84% and an F1-score83%. This displays that the model is performing well, with all metrics being above 80%.
[Figure 6] shows the training and validation loss plot illustrating the learning dynamics of the model over 200 epochs, showing a rapid initial decrease in both losses, indicating effective early learning. While the training loss stabilises at a low level, the validation loss exhibits notable fluctuations, likely due to overfitting as the model starts capturing noise in the training data. This is evident in instances where the validation loss surpasses the training loss, highlighting challenges in generalisation.
[Figure 7] shows the training and validation accuracy plot, which shows how the model learnt and how well it could generalise over 200 epochs. Initially, both accuracies show a steady improvement, reflecting effective learning. Around epoch 50, the accuracies stabilise, with both fluctuating between 80% and 85%. The model appears to
have little overfitting, as shown by the tight agreement between the
training and validation accuracies, which implies it does a good job
of generalising to new data. Despite these fluctuations, the model
achieves a reasonably high accuracy, showcasing its effectiveness in
addressing the research objectives.
The ROC curve illustrates the model’s classification performance,
with an AUC of 0.893, indicating strong predictive capability. The
curve’s steep rise towards the top-left corner reflects high sensitivity at
low false positive rates, while its gradual levelling demonstrates robust
performance across various thresholds. This excellent AUC result
is in line with the research goals since it shows that the model can
successfully differentiate between positive and negative classes. The
results highlight the model’s reliability for the classification task,
suggesting its suitability for real-world applications.
The evaluation of model performance, as shown in (Table II),
reveals that ANN demonstrated the highest effectiveness with an
accuracy86%, precision86%, recall84%, and an F1-score83, making
it the most reliable model for heart disease prediction. DT followed
closely with balanced metrics, including an accuracy of 77.5%,
precision of 77.4%, recall of 83%, and an F1-score of 80.1, indicating
consistent performance. SVM achieved a comparable accuracy of
78.1% but struggled with a low recall of 42.3%, resulting in the absence
of an F1-score due to its limited ability to identify positive cases
effectively. RF, on the other hand, exhibited the lowest performance
with an accuracy67%, precision64%, recall63%, and an F1-score66,
suggesting significant limitations in its predictive capability. Overall,
ANN stands out as the most effective model, excelling across all key
performance metrics.
Conclusion and Future Scope
The heart and the arteries that supply blood to it are susceptible
to a broad variety of conditions that are grouped together as heart
disease. To put it simply, ML algorithms construct models by
discovering latent patterns in the submitted dataset. This study
employed a variety of datasets, including the Cleveland Heart
Disease Dataset, to examine multiple ML approaches to cardiac
disease prediction. The primary objective was to assess the efficacy
of various classification models, including DT, SVM, RF, and ANN.
With an accuracy of 86%, precision of 86%, recall of 84%, and F1-
score of 83%, the results show that the ANN model performs better
than other methods. This highlights the robustness and reliability
of ANN in predicting heart disease, making it a promising tool for
early diagnosis in the healthcare sector. To improve an efficiency
of ML models, the research also highlighted the significance of
preprocessing, which comprises cleaning the data, removing outliers,
and selecting features. Accuracy, precision, recall, and F1-score were
the metrics used to assess the models, providing a holistic view of how
well they performed in practical clinical settings. Improved prediction
of cardiac disease may be possible in the future with an employ of
modern DL models coupled with real-time monitoring devices.
References
Citation
Jha KM, Velaga V, Routhu KK, Sadaram G, Boppana SB, et al. Evaluating the Effectiveness of Machine Learning for Heart Disease Prediction in Healthcare Sector. J Cardiobiol. 2025;09(1): 1.