
Journal of Cancer Sciences
Download PDF
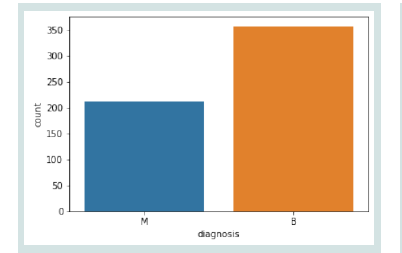 Figure 1
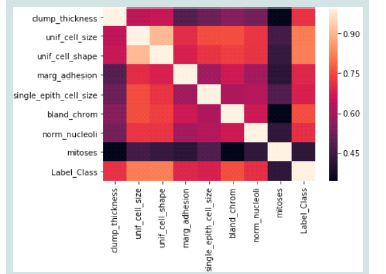 Figure 2
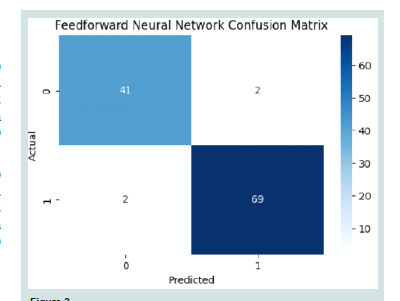 Figure 3
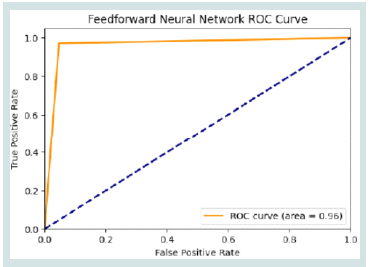 Figure 4
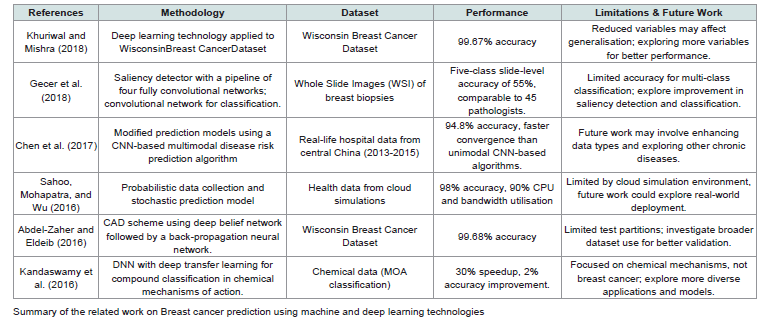 Table 1:provides an overview of different approaches to breast cancer classification and prediction, showcasing various methodologies, datasets, and performance outcomes.
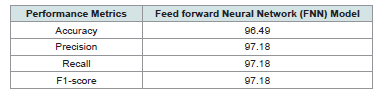 Table 2: Finding of Feedforward Neural Network (FNN) Performance for Breast
Cancer Prediction
Table 2: Finding of Feedforward Neural Network (FNN) Performance for Breast
Cancer Prediction
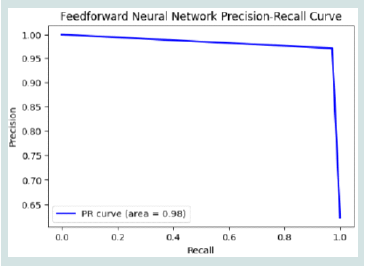 Figure 5
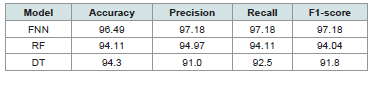 Table 3:Comparative Analysis for Breast Cancer Prediction on Breast Cancer
Wisconsin (Diagnostic) Dataset
Table 3:Comparative Analysis for Breast Cancer Prediction on Breast Cancer
Wisconsin (Diagnostic) Dataset
Research Article
Predictive Analytics for Disease Diagnosis: A Study on Healthcare Data with Machine Learning Algorithms and Big Data
Purna Chandra Rao Chinta1*, Chethan Sriharsha Moore2, Laxmana Murthy Karaka3, Manikanth Sakuru4, Varun Bodepudi5 and Srinivasa Rao Maka6
1Microsoft , Sr Technical Support Enginner
2Microsoft , Sr Technical Support Engineer
3Code Ace Solutions Inc, Software Engineer
4JP Morgan Chase, Lead Software Engineer
5Deloitte Consulting LLP, Senior Solution Specialist
6North Star Group Inc, Software Engineer
2Microsoft , Sr Technical Support Engineer
3Code Ace Solutions Inc, Software Engineer
4JP Morgan Chase, Lead Software Engineer
5Deloitte Consulting LLP, Senior Solution Specialist
6North Star Group Inc, Software Engineer
*Address for Correspondence:Purna Chandra Rao Chinta, Microsoft, Sr Technical Support Enginner
Email Id: chpurnachandrarao@gmail.com
Submission: 04 January, 2025
Accepted:31 January, 2025
Published:03 February, 2025
Copyright: © 2025 Chinta PCR, et al. This is an open access article
distributed under the Creative Commons Attribution License, which permits
unrestricted use, distribution, and reproduction in any medium, provided the
original work is properly cited.
Keywords: World Health Organization (WHO); Breast Cancer;
Tumour; Machine Learning; Healthcare; Disease Diagnosis;
Feedforward neural network (FFNN); Random Forest (RF); Decision Tree
(DT); Convolution Neural Network (CNN)
Abstract
At now, breast cancer ranks second among women in terms of
cancer-related deaths, making it a major epidemiological issue. The
illness is not caught early enough, and half of the one million women
diagnosed with breast cancer annually die from the condition. This
research aims to predict the occurrence of breast cancer using
various ML algorithms, including Feed forward Neural Network,
Random Forest, and Decision Tree, with the goal of reducing the risk
of death from this disease, which is a second most common cause of
death among women globally. This research uses the Breast Cancer
Wisconsin (Diagnostic) dataset to assess ML models that may diagnose
breast cancer. The FNN model outperformed RF and DT, achieving the
best overall performance with a precision, recall, and accuracy of
97.18%. These results highlight the FNN’s robustness in minimising false
positives and maximising true positives, making it a reliable tool for
breast cancer diagnosis. To further enhance the accuracy of feature
extraction and classification, future research may look at incorporating
stronger deep learning models such transformer architectures and
Convolution Neural Networks (CNNs). The model’s generalisability and
clinical usefulness might be further validated by using bigger and more
varied datasets.
Introduction
In terms of mortality rates, cancer ranks high among both sexes
worldwide. The most common malignancies are breast cancer, which
kills more women than any other illness and affects more women
than any other disease in the world. Breast cancer may be detected
early, which could lead to a survival rate of up to 80%, according to
the WHO [1]. There are almost 1.7 million new instances of breast
cancer identified each year, with 500,000 people losing their lives to
the condition. Unfortunately, these figures might rise in the years
to come [2,3]. Dense breast tissue, a personal or family history of
breast cancer, an older maternal age, the use of certain medications or
procedures during pregnancy, drinking alcohol, and other behavioral
variables are all potential risk factors for this kind of cancer [4]. The
impact of certain factors is substantial, while that of others is rather
little. Being a woman and getting older are unchangeable facts, but
may lessen our risk of breast cancer by living a healthy lifestyle.
There are three main ways to detect breast cancer: a physical
exam, a mammogram, or a biopsy. Professional radiologists are
required to interpret the results of these diagnostic procedures;
nonetheless, mammography is by far the most prevalent [5]. The
problem with having several readings of the same mammography
is that various radiologists get different conclusions. There is a 65%
to 78% accuracy rate for mammography. The malignant nature of
a tumour found by mammography may be determined by doing a
biopsy [6]. Although the accuracy rate of a biopsy is almost 100%, the
procedure is nonetheless invasive, expensive, time-consuming, and
unpleasant [7]. These issues make it more challenging for clinicians
to diagnose benign or malignant tumours. Because of these factors,
ML techniques have the potential to greatly impact the diagnostic
process.
The application of AI techniques for the early diagnosis of breast
cancer has recently increased. Learning theory is one kind of AI.
For the most part, healthcare organisations have used ML and DL
algorithms for breast cancer diagnosis [8]. The diagnostic accuracy
of a patient utilised to be entirely dependent on the knowledge and
skill of the doctor [9]. The accumulation of a physician’s expertise
is the result of years of closely observing patients’ symptoms [10].
However, the accuracy is unreliable. It is now simpler to collect and
store data because of the development of computer tools. Thus, the
field of intelligent healthcare systems is dependable and beneficial.
These technologies may assist doctors in diagnosing patients by
providing them with relevant and reliable standards. Individuals
might also benefit from these developments in terms of future health
planning. This is how ML can take over the laborious physical tasks
that healthcare workers face every day [11,12].
Motivation and Contributions of the Study:
This project aims to explore the use of ML algorithms on the
Breast Cancer Wisconsin (Diagnostic) dataset to assess predictive
analytics’ potential in disease diagnosis. By determining which model,
out of many options including FNN, RF, and Decision Tree, performs
the best, the study significantly advances medical diagnosis. The key
contributions are:
Collect the Wisconsin Diagnostic Breast Cancer dataset for breast
cancer detection.
Applied essential data preprocessing steps, including the removal
of duplicates, handling missing values, enhance data quality and
model performance.
Applied standardisation to scale the features of the dataset,
transforming them to have a mean of zero and unit variance.
Apply ML models like FNN, RF, DT for breast cancer detection.
Evaluated model performance employing accuracy, precision,
recall, F1-score, and AUC, focusing on a comprehensive
understanding of predictive capabilities, especially for imbalanced
datasets.
Organization of the paper:
Presented below is the outline of the paper: Section II finds
research gaps and evaluates pertinent literature. Section III details
the methodology, including data collection and the machine learning
models used. Section IV presents the results of the experiments and
the analysis of the model’s performance. Section V wraps up the
report by reviewing the results and offering suggestions for further
study.
Literature Review
They summarise the research on breast cancer prediction and
categorisation in this section. Classification methods were the
primary emphasis of the literature studied. Some reviews are:
In this study, Khuriwal and Mishra (2018) proposed using the
Wisconsin Breast Cancer database in an adaptive ensemble voting
method for breast cancer diagnosis. This study aims to examine
and explain how logistic and ANN algorithms, in conjunction with
ensemble ML algorithms, produce improved results for breast cancer
diagnosis, even when the number of variables is decreased. Wisconsin
Diagnosis Breast Cancer was the dataset used in this research. When
contrasted with similar literature. The Artificial Neural Network
(ANN) technique achieved a 98.50% accuracy rate while utilising the
logistic algorithm, according to an alternate ML methodology [13].
In this study, Gecer et al. (2018) provide a method for creating five
diagnostic categories from breast biopsy whole slide images (WSI).
A saliency detector using four fully convolutional networks trained
with data extracted from pathologists’ screening records is an integral
part of the WSI diagnosis process. After that, this detector will locate
diagnostically important regions using multi-scale methods. Then,
image patches are classified using a convolutional network based on
whether they are invasive cancer, ductal carcinoma in situ, atypical
ductal hyperplasia, proliferative changes, or non-proliferative. The
network is trained using reference samples collected from consensus.
At last, the saliency and classification maps are combined to label
pixels and classify slides, respectively. Both the saliency detector and
classifier networks outperformed rival algorithms in experiments,
including 240 WSI. There was no significant difference between the 45
pathologists’ opinions and a five-class slide-level accuracy55%. Breast
cancer diagnostic visualisations using the learnt representations are
also offered [14].
In this study, Chen et al. (2017), optimise techniques for ML to
accurately forecast the onset of chronic diseases in populations prone
to such outbreaks. A chronic illness of the brain, cerebral infarction,
is the subject of our experiments. They present a novel multimodal
illness risk prediction method that utilises hospital structured and
unstructured data and is based on CNNs. No prior research in
the field of medical big data analytics has, as far as they are aware,
addressed both forms of data simultaneously. With a convergence
time of only 94.8% and a prediction accuracy that surpasses that
of most conventional methods, the proposed method significantly
exceeds a CNN-based unimodal disease risk prediction algorithm
[15].
In this study, Sahoo, Mohapatra and Wu (2016) a probabilistic
data-gathering technique is created, and then the acquired data was
analysed for correlation. Lastly, a stochastic prediction model is made
to forecast the future health state of the most related folks based on
their existing status. Extensive cloud-based simulations allow for the
performance assessment of the suggested protocols; these simulations
achieve a prediction accuracy of around 98% while reducing analysis
time by 90% while maintaining 90% CPU and bandwidth utilisation
[16].
In this study, Abdel-Zaher and Eldeib (2016) by combining the
unsupervised route of a deep belief network with the supervised path
of back propagation, a CAD technique for breast cancer diagnosis has
been created. The architecture is a Backpropagation Neural Network
(BPN-NN) trained using the Liebenberg-Marquardt learning
function, with weights initially set using the Deep belief network
(DBN-NN) route. They validated our method using the WBCD or
Wisconsin Breast Cancer Dataset. A 99.68% accuracy rate from the
classifier complex is encouraging when compared to other published
research. As a breast cancer categorization model, the suggested
approach works well. A number of train-test partitions were also
considered when analysing the design [17].
In this study, Kandaswamy et al. (2016) are very interested in the
use of state-of-the-art ML techniques, such as DNNs, to categorise
substances involved in chemical MOAs. To classify compounds,
image-based profiling techniques have been used, sometimes in
conjunction with feature reduction techniques like factor or PCA.
This article demonstrates how to classify MOAs based on cell input
properties independently of treatment profiles and feature reduction
techniques. Our best understanding is that this is the first use of
DNN using single-cell data in this field. Additionally, they employ
DTL to reduce the computationally strenuous and time-consuming
process of scouring the vast parameter space of a DNN. The outcomes
indicate that this method results in a 30% increase in efficiency and a
2% increase in accuracy[18].
Methodology
This investigation is designed to assess an efficacy of ML models in
a detection of breast cancer by employing a Breast Cancer Wisconsin
(Diagnostic) dataset. A following steps of research design are shown
in [Figure 1] flowchart. Data preprocessing is conducted to ensure the
dataset is clean and ready for analysis, including removing duplicate
entries and handling missing values. Feature scaling is implemented
through standardisation to normalise the data, guaranteeing that
all features contribute equitably to the model’s efficacy. The preprocessed
data was then split into training (80%) and testing (20%)
sets. A variety of classification models, including FFNN, RF, and
DT, were ultimately used. In order to determine the most successful
model for breast cancer diagnosis, key measures such as F1-score,
recall, accuracy, and precision were used to evaluate each prototype.
Flowchart for Breast cancer Diagnosis
The following steps of a flowchart are briefly explained below:
Data Collection:
This study makes use of the Wisconsin Breast Cancer (Diagnostic)
Data Set, which is a dataset specifically designed for this purpose.
There are 569 samples in the collection, and each sample has 32
visually assessed atomic characteristics calculated from an image of a
breast mass’s FNA. The distribution of benign (B) and malignant (M)
tumours, as diagnosed, is displayed in [Figure 2].
Class Distribution of data:
A class distribution analysis in [Figure 2] shows an imbalanced
dataset, with the majority class (“B”) having significantly more
instances than the minority class (“M”). This imbalance can lead to
model bias, causing poor performance in a minority class. In these
cases, standard accuracy may not be a reliable statistic. Thus, it’s better
to use evaluation metrics like precision, recall, F1-score, and AUC,
which provide a more realistic evaluation of the model’s performance
on imbalanced datasets.
Correlation Matrix of Data:
[Figure 3s] heatmap shows the relationship between several
attributes, probably taken from a dataset. A color intensity varies
from dark purple to light pink, indicating the strength of correlation
ranging from about 0.45 to 0.90. This kind of visualisation is useful
for understanding how different variables in a dataset are related to
each other, which is crucial for feature selection in model-building
processes.
Data Preprocessing:
Data preparation in the context of breast cancer detection
utilising the Wisconsin dataset entails cleaning, organising, and
standardising the data so that it may be used to develop accurate and
trustworthy diagnostic models [19]. A vital part of data cleaning is
removing duplicates, which makes sure that there aren’t any records
that are both relevant and redundant, which could affect the accuracy
of analyses and models. Key pre-processing steps are listed below:
Removing duplicate Entries:
Data cleaning and preparation include removing duplicates
to make sure the data is correct and dependable for modelling or
analysis.
Handling Missing values:
Data points lacking a value for a particular variable in a dataset
are called missing values [20]. Data analysis becomes much more
difficult due to missing data points, which might cause results to be
biased or erroneous.
Feature Scaling:
Machine learning also makes use of the standard scaler, sometimes
known as standardisation, to scale features. Each feature is averaged
to a zero-variance mean using this procedure [21,3]. Although this
method does not restrict the data to a certain time frame or alter its
distribution, it does guarantee that the majority of data points will
be close to 0. This indicates that no matter how much data is scaled,
outliers will remain. Equation 1 shows the definition of standard
scaling.
Where:
xscaled = scaled sample point
x = sample point
x¯ = mean of the training samples
σ = standard deviation of the training samples
Data Splitting:
There are two subsets of the dataset: the training set and the testing
set. The model is trained using the training set, and its performance
is evaluated using the test set. The Data was divided into the 80:20.
Proposed Feed forward Neutral Network (FNN) Models:
DNNs are computer models that use a layer-by-layer architecture
and a large number of neurones (node) linked together by synaptic
connections (weights) [22-24]. As a result, FNNs adhere to a
particular architectural arrangement in which each layer’s nodes
are linked to the layer below them via forward connections [25].
The limited number of neurones in a single internal hidden layer
of a FNN allows it to approximate any continuous function with an
activation function that is continuous and sigmoidal in nature. The
connection weights provide input that a node in a FNN can process.
It is possible to calculate the mathematical output yi (excitation) of a
node (node i) as (2):
Where:
is a total incoming connection,
is an input,
is a weight,
is a bias, and
(·) determines a range of possible values for the i-th node’s output
amplitude, which is controlled by the activation function.
Evaluation Parameters:
F1 score, recall, accuracy, and precision are important
performance indicators for evaluating a model’s efficacy and helping
to comprehend its predictive skills as well as finding places for
development [26]. The equations of metrics, as shown in, are based
on the fundamental measuring parameters of the confusion matrix,
The following factors should be taken into account when measuring
the parameters:
True Positive (TP): Correctly identify the presence of disease.
True Negative (TN): Correctly forecast the absence of disease.
False Positive (FP): Incorrectly forecast the disease is present
when it’s not.
False Negative (FN): Fail to detect the disease when it is present.
Accuracy: Equation 3 offers the formula for calculating the
percentage of true outcomes (including TN and TP) relative to a total
number for gauging accuracy:
Precision: the proportion of states that were considered
interesting (loaded in this case) and truly exist in that state for the
purpose of measuring precision. In Equation 4:
Recall: the percentage of intriguing states accurately identified
as such [25]. Another name for it is Recall or Sensitivity [27]. The
formula for measuring recall is mentioned in Equation 5:
F1-score: a measure of both accuracy and memory that yields the
proportion of correctly identified occurrences [28]. The formula for
measuring F1-score are mentioned in Equation 6:
The Findings are obtained by evaluating the model’s performance
using these performance metrics on the testing set.
Result Analysis and Discussion
Here, the outcomes for the various classification systems used in
this study are examined. Our research employed ML techniques for
an effective detection of breast cancer, specifically focusing on models
such as FNN that compare with RF [29] and DT [30] shown in [Table 3]. An effectiveness of these algorithms was evaluated employing
the Breast Cancer Wisconsin (Diagnostic) dataset. Important
performance measures utilised to assess a model’s utility were F1-
score, recall, accuracy, and precision. [Table 2]. shows the results of
the proposed model.
Bar Graph for Performance of FNN Model:
[Table 2] and [Figure 4] presents a performance of the FNN
model for breast cancer prediction. The model achieved an accuracy
of 96.49%, with both precision and recall scores reaching 97.18%.
Additionally, the F1-score was also 97.18%, indicating a well-balanced
performance according to both sensitivity and specificity. These
results suggest that the FNN model is highly effective for predicting
breast cancer, demonstrating strong classification performance across
key metrics. [31-40]
Confusion matrix for FNN Model:
In the [Figure 5] displays a confusion matrix for a FNN, presented
in a 2x2 grid format. The matrix is labelled with “Actual” on a y-axis
and “Predicted” on an x-axis, indicating two classes (0 and 1). The
values within the matrix are: 41 TN and TP, representing correct
predictions for classes 0 and 1, respectively. There are 2 FP and 2 FN,
illustrating instances where the predictions did not match the actual
classes. The matrix uses a colour gradient from light to dark blue to
represent the range of values from low to high, accompanied by a
colour bar on the right showing values from 0 to 60.
ROC curve of FNN Model:
The [Figure 6] displays a ROC curve for a FNN. It plots the TPR
against the FPR across a range of threshold values. The ROC curve,
represented by a solid orange line, sharply rises close to a top-left
corner of a graph, suggesting high model performance. The AUC
is notably high at 0.96, indicating excellent discriminative ability.
A dashed blue line, representing a random classifier’s performance,
diagonally divides the plot, providing a baseline for comparison.
Precision-recall curve of FNN Model:
The FNN model’s Precision-Recall curve in [Figure 7] shows strong
performance with an AUC of 0.98, indicating good identification of
true positives. Initially, precision is high, but it gradually drops as
recall increases, typical of precision-recall curves. The sharp drop in
precision suggests potential class imbalance, as the model sacrifices
precision to capture more true positives.
[Table 3]. above displays the outcomes of comparing a models’
performance. Among an algorithms tested, FNN performed best with
an accuracy of 96.49%, surpassing both RF (94.11%) and DT (94.3%).
The FNN’s remarkable recall and precision scores of 97.18% show that
it is very good at reducing FP and increasing real positive detections.
In comparison, the RF model demonstrated a precision of 94.97%
and a recall of 94.11%, reflecting its effectiveness but slightly lower
than that of the FNN. The Decision Tree model, while achieving a
respectable accuracy of 94.3%, had lower precision at 91.0% and recall
at 92.5%, suggesting it may face challenges in accurately identifying all
positive cases. The FNN is the best model for detecting breast cancer
overall, outperforming all other models in every metric, highlighting
its potential to improve diagnostic precision in clinical settings [41-57]. Based on results its evident that AI technology may improve
clinical care, education and training. However, clear regulation and
understanding by clinicians are needed. ML is a subfield of AI creating
systems that can improve predictions and decisions by exposure to
data, thereby imitating human learning [58,59].The integration
of advanced preprocessing techniques with machine learning
significantly enhances the accuracy of mammography analysis,
facilitating more precise differentiation between malignant and
benign breast lesions [60]. Problems such as model generalization,
bias, transparency, interpretability, accountability, and data privacy
remain barriers for broad adoption AI in cardiology [61].Significant
potential of AI-based algorithms in enhancing the accuracy of BC
survival predictions. However, further exploration and research are
essential to fully understand the true impact and effectiveness of these
methods [62].
V. Conclusion and Future Scope:
Cancer is a major public health concern since it is a major
killer and is on the rise around the world. Breast cancer ranks high
among malignancies, particularly among females, according to
current studies. Early detection can reduce treatment costs and
improve survival rates for people with breast cancer. Nevertheless,
the early diagnosis techniques used in modern healthcare systems
have disadvantages. This study uses the Breast Cancer Wisconsin
(Diagnostic) dataset to assess ML algorithms that can detect breast
cancer. The results showed that Feedforward Neural Networks (FNN)
were more effective than RF and DT models in detecting breast cancer.
With an accuracy of 96.49% and high recall, precision, and F1-scores,
the FNN proved robust in minimising false positives and maximising
true positives. Nevertheless, the model’s generalisability could be
compromised by obstacles including possible class imbalance and the
dataset’s small size and lack of diversity. To tackle these issues, future
research could use bigger and more varied datasets in conjunction
with sophisticated deep-learning methods like CNNs or transformers.
Additionally, integrating explainable AI methods could enhance
model interpretability, facilitating its adoption in clinical settings for
reliable and transparent diagnostic support.
References
Citation
Chinta PCR, Moore CS, Karaka LM, Sakuru M, Bodepudi V, et al. Predictive Analytics for Disease Diagnosis: A Study on Healthcare Data with Machine Learning Algorithms and Big Data. J Cancer Sci. 2025;10(1): 1.