Journal of Surgery
Download PDF
Research Article
*Address for Correspondence: Abbas Rana, MD, Division of Abdominal Transplantation, Department of Surgery, University of Arizona, 1501 N. Campbell Avenue, Tucson, AZ 85718, USA, Tel: (520) 626-6211; E-mail: arana@surgery.arizona.edu
Citation: Rana A, Gruessner A, Porubsky M, Jie T, Habib S, et al. The Donor Risk Score: A Simpler Method to Grade Liver Allografts. J Surgery. 2013;1(2): 6.
Copyright © 2013 Rana A, et al. This is an open access article distributed under the Creative Commons Attribution License, which permits unrestricted use, distribution, and reproduction in any medium, provided the original work is properly cited.
Journal of Surgery | ISSN: 2332-4139 | Volume: 1, Issue: 2
Submission: 07 September 2013 | Accepted: 01 November 2013 | Published: 06 November 2013
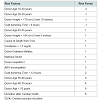
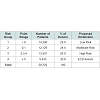
The donors were then arbitrarily divided into four donor risk groups based on the DRS point distribution of donor allografts: Low Risk (less than 0 points), Moderate Risk (0 or 1 point), High Risk (2-4 points), and Extended Criteria (greater than or equal to 5 points). The four groups were designed to ensure equal distribution among transplanted allografts (Table 4). Model discrimination was assessed using the area under the receiver operating curve (c-statistic). The c-statistic is commonly used in evaluating a prognostic model. A c-statistic of 1 would result from perfect prognostic accuracy while a c-statistic of 0.5 results from a model without prognostic accuracy [6].
Univariate and multivariate analysis
The area under the receiver operating curve
The Donor Risk Score: A Simpler Method to Grade Liver Allografts
Abbas Rana*, Angelika Gruessner, Marian Porubsky, Tun Jie, Shahid Habib, Horacio Rilo, and Rainer W.G. Gruessner
- Division of Abdominal Transplantation, Department of Surgery, University of Arizona, Tucson, AZ 85718, USA
*Address for Correspondence: Abbas Rana, MD, Division of Abdominal Transplantation, Department of Surgery, University of Arizona, 1501 N. Campbell Avenue, Tucson, AZ 85718, USA, Tel: (520) 626-6211; E-mail: arana@surgery.arizona.edu
Citation: Rana A, Gruessner A, Porubsky M, Jie T, Habib S, et al. The Donor Risk Score: A Simpler Method to Grade Liver Allografts. J Surgery. 2013;1(2): 6.
Copyright © 2013 Rana A, et al. This is an open access article distributed under the Creative Commons Attribution License, which permits unrestricted use, distribution, and reproduction in any medium, provided the original work is properly cited.
Journal of Surgery | ISSN: 2332-4139 | Volume: 1, Issue: 2
Submission: 07 September 2013 | Accepted: 01 November 2013 | Published: 06 November 2013
Abstract
Context: Growing need for liver transplantation has led to increased efforts to utilize allografts for transplantation from an expanding donor pool (“marginal” donor livers).Objective: To devise a simplified practical donor allograft scoring system based primarily on allograft survival following liver transplantation.
Methods: The United Network of Organ Sharing (UNOS) provided de-identified patient-level data. This study included all liver transplant recipients who received allografts between between March 1, 2002 and December 31, 2012. Patients who received combined, multivisceral, or live donor transplants and those with no available follow-up data were excluded from this study. We therefore analyzed a total of 49,656 liver transplant recipients for this study. Kaplan-Meier analysis with log-rank test and Cox proportion hazards regression were used for time-to-event analysis. Univariate and multivariate analyses identified significant and independent risk factors.
Results: In addition to cold ischemia time we identified nine donor risk factors as significant for graft failure: 1) donor age, 2) donor height, 3) CVA as cause of death, 4) donor renal insufficiency, 5) diabetes in the donor, 6) national sharing, 7) hepatitis C in the donor, 8) ABO incompatible transplants and 9) donation after cardiac death. The most significant of these were 1) donation after cardiac death (RR 1.6) and 2) donor age > 70 (RR 1.6). Our novel Donor Risk Score assigns points to each donor risk factor on the basis of severity and these are ultimately added to each other to derive the final DRS score (total points) for a given allograft. Extended criteria donor allografts are defined as an allograft with five or more risk points which represent the worst 20% of allografts.
Conclusion: The novel Donor Risk Score (DRS) is a simplified and practical method to evaluate and grade liver allografts. The derived risk points are simply added to each other to assign a DRS to the donor which is simpler to use to predict donor liver function than the presently recommended Donor Risk Index (DRI) that employs a complex exponential function. The DRS that we propose is also more marginally more predictive of graft survival compared to the DRI (c-statistic 0.58 vs 0.57, p < 0.001).
Introduction
Increased demands for liver transplantation along with shortage of deceased donor liver allografts have led to the use of organs from extended donor pool (“marginal” donors) for transplantation [1]. It is therefore necessary to develop methods to accurately evaluate or grade the quality of such allografts obtained from Extended Criteria Donors (ECD) on the basis of their expected survival to be able to provide adequate information to the potential recipients to obtain informed consent. Risk assessment of ECD allografts should also permit clinicians to determine whether an allograft’s projected risk is suitable for a particular recipient. The previously described Donor Risk Index (DRI) addresses this need for assessment of the quality of the donor allografts [2]. Since the DRI is calculated from an exponential function composed of seven donor factors and cold ischemia time it is somewhat complex and fails to take into account other significant risk factors that affect eventual allograft survival. The calculations for DRI are shown below.Donor risk index = exp[(0.154 if 40≤ age <50) + (0.274 if 50≤ age <60) + (0.424 if 60≤ age <70) + (0.501 if 70 ≤ age) + (0.079 if COD = anoxia) + (0.145 if COD = CVA) + (0.184 if COD = other) + (0.176 if race = African American) + (0.126 if race = other) + (0.411 if DCD)+(0.422 if partial/split)+(0.066 ((170–height)/10))+(0.105 if regional share)+(0.244 if national share)+(0.010×cold time)]2.
The Scientific Registry for Transplant Recipients (SRTR) has proposed another risk adjusted allocation model in the format of a computer program to grade allografts and guide allocation that is based on both recipient and donor risk factors [3]. There are two additional models which integrate donor and recipient risk factors to predict patient [4] and graft survival [5], but they both use complex statistical equations to do so. Since offers of donor organs occur at all times of day from various sources, we felt that a simplified and practical system that is not based on complex calculations is still needed to rapidly assess the quality of offered donor livers. Furthermore, a simplified donor scoring system allows the clinician to form an accurate perspective on the relative risk of particular risk factors.
Methods
Study populationThe UNOS provided de-identified patient-level data. Our analysis employed the liver registry with data collected by the Organ Procurement and Transplantation Network. This study includes all transplant recipients transplanted between March 1, 2002 and December 31, 2012. The latest data include follow-ups through December 31, 2012. Donor and recipient characteristics were collected at the time of transplantation. Follow-up information was collected at six months and then yearly after transplantation. In this retrospective study we have included all transplant recipients 18 years of age or older but excluded 1) recipients of combined or multi-visceral transplants (n=3,741) receiving; 2) recipients of livedonor allografts (n=2,189) and 3) patients with insufficient follow-up data for analysis (n=0). All patients were followed from the date of transplant until either death (n=12,852), retransplantation (n=2,821) or date of last known follow-up (n=31,812). After exclusions, this analysis included a total of 49,656 recipients.
Data analysis
All data was analyzed using a standard statistical software package, Stata 9 (Stata Corp, College Station, TX). Continuous variables were reported as a mean ± standard deviation and compared using the Student’s t-test. The Chi-square test was used to compare categorical variables. Results were considered significant at a p-value of <0.05. All reported p-values are two-sided. The primary outcome measure was graft failure. Time to graft failure was assessed as time from date of transplantation to the date of death or of re-transplantation. Kaplan-Meier analysis with log-rank test and the Cox proportional hazards regression model were used for time-to-event analysis.
Risk factors
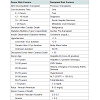
The recipient and donor risk factors considered in this analysis are listed in Table 1. We used characteristics most representative of the majority of liver transplant recipients as the reference groups. Serum creatinine was utilized instead of a calculated creatinine clearance because serum creatinine is most readily accessible for rapid assessment of quality of donor liver. In addition to 40 covariates listed in Table 1 we have included the majority of covariates previously analyzed in the SRTR risk adjusted models.Risk scoreTo determine the predictors of graft failure after transplantation, Cox regression analysis of all donor and recipient risk factors was performed. The donor and recipient variables initially underwent a separate univariate analysis, as shown in Table 1. Donor and recipient variables found to be significant in univariate analysis then together underwent multivariate analysis. Points were only assigned to each donor risk factor based on the risk factor’s associated relative risk of graft failure. One point was awarded to each risk factor for every 10% increase in risk for graft failure. Importantly, negative points were also awarded for every 10% decrease in risk for graft failure.
The donors were then arbitrarily divided into four donor risk groups based on the DRS point distribution of donor allografts: Low Risk (less than 0 points), Moderate Risk (0 or 1 point), High Risk (2-4 points), and Extended Criteria (greater than or equal to 5 points). The four groups were designed to ensure equal distribution among transplanted allografts (Table 4). Model discrimination was assessed using the area under the receiver operating curve (c-statistic). The c-statistic is commonly used in evaluating a prognostic model. A c-statistic of 1 would result from perfect prognostic accuracy while a c-statistic of 0.5 results from a model without prognostic accuracy [6].
Results
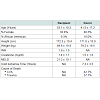
Study populationThe study population included 50,725 patients. Analysis included 181,769 years at risk for all liver transplant recipients. Mean follow-up was 3.9 years, and restricted mean survival was 8.3 years. Demographic and clinical characteristics are summarized in Table 2.
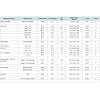
The data entry completion rate for donor variables that were significant in univariate analysis is listed in Table 3. The majority of variables are well populated.
Univariate and multivariate analysis
The multivariate analysis of donor risk factors that were significant in multivariate analysis is presented in Table 3. The most significant donor risk factors were 1) donation after cardiac death (RR 1.6 CI 1.5-1.7), donor age > 70 (RR 1.6 CI 1.5-1.8); 2) donor age 60-70 (RR 1.4 CI 1.4-1.5): 3) donor age 55-60 (RR 1.3 CI 1.2-1.4).
The following recipient risk factors were the most significant in multivariate analysis: previous transplant (RR 2.2 CI 2.0-2.4); life support (RR 1.6 CI 1.5-1.7); recipient age over 70 (RR 1.4 CI 1.3-1.6); and African-american race (RR 1.4 CI 1.3-1.5).
Risk score
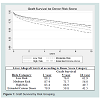
Table 4 presents the Donor Risk Score (DRS), which includes the following ten factors: 1) donor age, 2) donor height, 3) cold ischemia time, 4) cause of death from cerebrovascular accident, 5) creatinine > 1.5 mg/dL, 6) donor diabetes, 7) national sharing, 8) donor hepatitis C, 9) abo incompatibility, and 10) donation after cardiac death. Table 5 illustrates the population distribution based on the group with less than 0 points (≡ Low Risk). Figure 1 presents the Kaplan-Meier curves and life-table analysis of liver allograft survival based on DRS groups. The 1 year, 5 year, and 10 year graft survival was respectively: 89.1%, 76.0%, and 61.9% for the Low Risk group; 87.4%, 71.7%, and 56.0% for the Moderate Risk group; 83.4%, 66.9%, and 49.7% for the High Risk group; and 79.9%, 59.8%, and 41.5% for the ECD group.
Figure 1: Graft Survival by Risk Grouping. Prediction of liver allograft survival by DRS risk groups by Kaplan-Meier analysis. Abscissa shows Percentage of graft survival in all recipients. Ordinate shows time in Years following liver transplantation. P value < 0.001 for each group by log rank test using Low Risk group (less than 0 points) as the reference.
The c-statistic for the DRS, when used as a model to predict graft failure, was 0.58 (CI 0.57-0.58). The DRS appeared more accurate than the Donor Risk Index (DRI), which had a c-statistic of only 0.57 (confidence interval 0.56-0.57 and p < 0.001) for the same cohort of patients in the UNOS database.
Discussion
The increasing public demand for liver transplantation has led to the wider use of extended criteria donor (ECD) allografts [1]. An accurate, simple, and practical model to assess the quality of a potential donor allograft is required to allow the recipient of an ECD allograft to give a truly informed consent. The development of such a model should also be able to predict the risk for allograft survival to assist in the allocation of a particular donor organ to an appropriate liver transplant candidate. The DRI model has been widely accepted as a method of assessing the quality of donor liver allografts [2]. The DRI, however, depends on complex calculations of an exponential function which includes seven donor factors in addition to cold ischemia time.In the present study, we have formulated through a multivariate analysis, a new model, the Donor Risk Score (DRS), which does not require any complex calculations and facilitates a slightly more accurate prediction of graft survival than the DRI. The DRS is composed of nine donor factors and cold ischemia time; this includes all factors used in the DRI with the exception of split allografts and African American race. In addition, the DRS incorporates the risks of donor diabetes mellitus, donor creatinine > 1.5 mg/dL, and ABO incompatibility. These risk factors are clearly established in the literature [2,4,5,7-17] as negative influences on liver allograft survival. Diabetes mellitus as a liver donor risk factor is likely related to localized atherosclerotic changes in the donor allograft [2].
When the use of DRS is compared to that of DRI, it is found to be simpler despite the inclusion of additional donor risk factors, and has a slightly better predictive value for the donor liver allograft survival. The use of DRS requires only the arithmetic addition of points previously assigned to the various donor factors. The DRS has a significantly better c-statistic when used as a model to predict graft survival (0.58 vs. 0.57, p < 0.001) in this study’s transplant recipients’ cohort. The DRS and DRI did not have statistically different c-statistics when they were used to predict patient survival.
The DRS and DRI are both relatively ineffective in predicting graft and patient survival. However, among all formulas that use donor risk factors available for study, these two models provide the most accurate model for predicting eventual graft survival [2,18]. They therefore are the best available tools to assess the quality of donor allografts. The low c-statistics obtained using both methods may reflect the known fact that donor factors offer only one significant influence on graft and patient survival. The recipient risk factors are numerous and have also been shown to wield significant influence on graft and patient survival; these include recipient age, previous transplant, serum creatinine, bilirubin, UNOS priority status, BMI, Meld Score, African American race, serum albumin, etc [4,5,19]. We realize that there are other significant donor risk factors not amenable for study in this retrospective registry review. Although macrosteatosis of the donor liver is a well known donor risk factor in clinical experience [20-22] it has been left out of the DRS as well as out of the DRI because of lack of sufficient data for analysis since only 33.4% of allografts had documented liver biopsies. Micro- and macrosteatosis were not differentiated in the data entry, and steatosis levels were recorded only in broad percent ranges. Steatosis (without differentiation of micro and macrosteatosis) of the liver allograft was previously included in the DRI analysis but was not found to be a significant risk factor [2]. The donor surgeon’s impression of the donor allograft based on its color and consistency is undoubtedly an essential factor but difficult to quantify and study.
The newly developed DRS provides a simple and flexible definition for ECD donors - any liver allograft that receives five or more risk points. This definition includes about 20% of available donor liver allografts. This classification incorporates all of the significant donor risk factors in all possible combinations and can be rapidly applied to donor allograft selection as offers are made. At this point, there is no consensus over the definition of ECD allografts in liver transplantation [26]. This is an important definition for patient consent.
Conclusion
The Donor Risk Score (DRS) is a simple and reliable method to evaluate and grade the quality of donor liver allografts. The provided risk points are arithmetically added to each other to define the risk group to which the organ belongs. This approach is simpler to use than the Donor Risk Index (DRI) that employs a complex exponential function. The DRS is also slightly more accurately predictive of liver allograft survival compared to the calculations using DRI (c-statistic 0.58 vs 0.57, p < 0.001).References
- Busuttil RW, Tanaka K (2003) The utility of marginal donors in liver transplantation. Liver Transpl 9: 651-663.
- Feng S, Goodrich NP, Bragg-Gresham JL, Dykstra DM, Punch JD, et al. (2006) Characteristics associated with liver graft failure: the concept of a donor risk index. Am J Transplant 6: 783-790.
- Levine GN, McCullough KP, Rodgers AM, Dickinson DM, Ashby VB, et al. (2006) Analytical methods and database design: implications for transplant researchers, 2005. Am J Transplant 6: 1226-1242.
- Ghobrial RM, Gornbein J, Steadman R, Danino N, Markmann JF, et al. (2002) Pretransplant model to predict postransplant survival in liver transplant patients. Ann Surg 236: 315-322.
- Ioannou GN (2006) Development and validation of a model predicting graft survival after liver transplantation. Liver Transpl 12: 1594-1606.
- Hanley JA, McNeil BJ (1982) The meaning and use of the area under a receiver operating characteristic (ROC) curve. Radiology 143: 29-36.
- Dawwas MF, David C, Barber KM, Watson CJ, Neuberger J, et al. (2007) Developing a liver transplantation donor risk index in a national registry. Hepatology 46: 235A.
- Busquets J, Xiol X, Figeras J, Jaurrieta E, Torras J, et al. (2001) The impact of donor age on liver transplantation: influences of donor age on early liver function and on subsequent patient and graft survival. Transplantation 71: 1765-1771.
- Detre KM, Lombardero M, Belle S, Beringer K, Breen T, et al. (1995) Influence of donor age on graft survival after liver transplantation--United Network for Organ Sharing Registry. Liver Transpl Surg 1: 311-319.
- Yersiz H, Shaked A, Olthoff K, Imagawa D, Shackleton C, et al. (1995) Correlation between donor age and the pattern of liver graft recovery after transplantation. Transplanation 60: 790-794.
- Hoofnagle JH, Lombardero M, Zetterman RK, Lake J, Porayko M, et al. (1996) Donor age and outcome of liver transplantation. Hepatology 24: 89-96.
- Oh CK, Sanfey HA, Pelletier SJ, Sawyer RG, McCullough CS, et al. (2000) Implication of advanced donor age on the outcome of liver transplantation. Clin Transplant 14: 386-390.
- Merion RM, Rush SH, Dykstra DM, Goodrich N, Freeman RB, et al. (2004) Predicted lifetimes for adult and pediatric split liver versus adult whole liver transplant recipients. Am J Transplant 4: 1792-1797.
- Humar A, Ramcharan T, Sielaff TD, Kandaswamy R, Gruessner RW, et al. (2001) Split liver transplantation for two adult recipients: an initial experience. Am J Transplant 1: 366-372.
- Azoulay D, Castaing D, Adam R, Savier E, Delvart V, et al. (2001) Split liver transplantation for two adult recipients: feasibility and long term outcomes. Ann Surg 233: 565-574.
- Doshi MD, Hunsicker LG (2007) Short- and long-term outcomes with the use of kidneys and livers donated after cardiac death. Am J Transplant 7: 122-129.
- Abt PL, Desai NM, Crawford MD, Forman LM, Markmann JW, et al. (2004) Survival following liver transplantation from non-heart-beating donors. Ann Surg 239: 87-92.
- Briceno J, Solorzano G, Pera C (2000) A proposal for scoring marginal liver grafts. Transpl Int 13: S249-S252.
- Saab S, Wang V, Ibrahim AB, Durazao F, Han S, et al. (2003) MELD score predicts 1-year patient survival post-orthotopic liver transplantation. Liver Transpl 9: 473-476.
- D’Alessandro AM, Kalayoglu M, Sollinger HW, Hoffmann RM, Reed A, et al. (1991) The predictive value of donor liver biopsies for the development of primary nonfunction after orthotopic liver transplantation. Transplantation 51: 157-163.
- Adam R, Reynes M, Johann M, Morino M, Astarcioglu I, et al. (1991) The outcome of steatotic grafts in liver transplantation. Transplant Proc 23: 1538-1540.
- Todo S, Demetris AJ, Makowka L, Teperman L, Podesta L, et al. (1989) Primary nonfunction of hepatic allografts with preexisiting fatty infiltration. Transplantation 47: 903-905.
- Kamath PS, Wiesner RH, Malinchoc M, Kremers W, Therneau TM, et al. (2001) A model to predict survival in patients with end-stage liver disease. Hepatology 33: 464-470.
- Wiesner R, Edwards E, Freeman R, Harper A, Kim R, et al. (2003) Model for end-stage liver disease (MELD) and allocation of donor livers. Gastroenterology 124: 91-96.
- Rana A, Hardy MA, Halazun KJ, Woodland DC, Ratner LE, et al. (2008) Survival outcomes following liver transplantation (SOFT) score: a novel method to predict patient survival following liver transplantation. Am J Transplant 8: 2537-2546.
- Busuttil RW, Tanaka K (2003) The utility of marginal donors in liver transplantation. Liver Transpl 9: 651-663.


