Journal of Addiction & Prevention
Past Year Alcohol Consumption Patterns, Alcohol Problems and Alcohol-Related Diagnoses in the New Zealand Mental Health Survey
Jessie Elisabeth Wells* and Magnus Andrew McGee
- Department of Population Health, University of Otago, Christchurch 8140, New Zealand
*Address for Correspondence Jessie Elisabeth Wells, Department of Population Health, University of Otago, Christchurch PO Box 4345, Christchurch 8140, New Zealand, Tel:64+-3-364-3602; Fax: +64-364-3614; E-mail: elisabeth.wells@otago.ac.nz
Citation: Wells JE, McGee MA. Past Year Alcohol Consumption Patterns, Alcohol Problems and Alcohol-Related Diagnoses in the New Zealand Mental Health Survey. J Addiction Prevention. 2015;3(1): 11.
Copyright ©2015 Wells JE, et al. This is an open access article distributed under the Creative Commons Attribution License, which permits unrestricted use, distribution, and reproduction in any medium, provided the original work is properly cited.
Journal of Addiction & Prevention | ISSN: 2330-2178 | Volume: 3, Issue: 1
Submission: 20 March, 2015 | Accepted: 15 April, 2015 | Published: 20 May, 2015
Abstract
Background: Criteria for the diagnosis of alcohol abuse or dependence in DSM-IV or ICD-10 do not include measures of alcohol consumption. However the Alcohol Use Disorders Identification Test (AUDIT) contains three consumption questions (AUDIT-C) plus seven problem questions. The AUDIT-C has often been used as a short screening questionnaire. Here drinking patterns in the past year are analysed, and the AUDIT-C and other combinations of those three questions are related to alcohol problems or diagnoses in the same period.
Method: The 2003-2004 New Zealand Mental Health Survey(N=12,992), a nationally representative survey, included the AUDIT and the Composite International Diagnostic Interview (CIDI) 3.0. Latent class analyses were used to discover patterns of alcohol consumption (AUDIT-C) and patterns of alcohol problems. Cross-tabulations, Receiver Operating Characteristic Curves and logistic regression were used to relate consumption to problems and diagnoses.
Results: Analyses indicated that drinking frequency (Q1) was an ineffective screening question. Amount consumed per drinking day (Q2) plus frequency of per-occasion heavy drinking (Q3) was as good as or better than the AUDIT-C, with Q3 alone nearly as good. For a given consumption score, males were only slightly more likely than females to experience negative consequences from their drinking whereas age differences were more substantial. For both sexes and all age groups, a reasonable sensitivity of around 80% was achieved with often rather low specificity for detection of any drinking problems (specificities 57-81%). However there was higher specificity for detection of multiple problems, or diagnosis (specificities 72-85%).
Conclusions: Usual drinking frequency is a poor screening indicator of past year alcohol problems and alcohol diagnoses, and does not improve on frequency of heavy per-occasion drinking, or that question plus usual quantity consumed. Retention of the usual drinking frequency question in the AUDIT-C must be based on considerations apart from its value in screening.
Keywords
Alcohol drinking; Alcohol-related disorders; Epidemiology; Age; Women; Men; Screening
Introduction
Assessment of alcohol consumption per se is not included in criteria for the diagnosis of alcohol abuse or dependence in DSM-IV [1] or ICD-10 [2]. These criteria include risks from or consequences of consumption, tolerance, withdrawal, and behaviours related to alcohol such as inability to reduce consumption and restriction of other activities, but not measures of consumption itself. Yet, as the risks or consequences depend on the patterns of consumption, including quantity and frequency, understanding the epidemiology of alcohol disorders requires an understanding of patterns of consumption and their relationship to alcohol problems and diagnoses. Furthermore, assessment of consumption can be and has been used to screen for problems and disorders. This paper sets out to investigate patterns of alcohol consumption in past-year drinkers, and how well measures of consumption indicate past-year alcohol problems and alcohol diagnoses.
In contrast to diagnostic sections of interviews based on DSM-IV or ICD-10, in the ten item Alcohol Use Disorders Identification Test (AUDIT) [3] the first three items are about alcohol consumption: usual frequency of consumption, usual quantity consumed, and frequency of consuming six or more drinks. In community surveys a score of 8 or more on the AUDIT is commonly used to define hazardous drinking [4]. Such a score can be attained from the consumption items alone, with a pattern of weekly heavy episodic drinking. For example someone consuming up to three times per week (Q1 – score of 3), and usually consuming 7-9 drinks per occasion (Q2 – score of 3), therefore must be consuming six or more drinks at least weekly (Q3 – score of 3), which yields a score of 9 out of a possible maximum of 12 on those three questions alone.
The AUDIT [3] was developed in the 1980s for use as a unidimensional screener in primary care covering three aspects: consumption, dependence symptoms and other consequences [3]. There have been numerous studies investigating the relationship between the AUDIT and diagnoses of alcohol abuse or dependence, both in the community and in primary care; these have been reviewed by Reinert and Allen [4,6]. In addition to the full AUDIT, shorter versions of the AUDIT have also been evaluated as screeners [4,7,9], including the AUDIT-C which provides a score by summing the first three items of the AUDIT, namely the consumption items [4]. In a US population survey the AUDIT-C performed well for detecting alcohol use disorders and risky drinking, although lower cut points for women than for men improved its sensitivity and specificity [10]. Reinert and Allen also reported other studies which found advantages from lower cut points for women [4].
There have been recommendations stressing the need to move beyond measures of usual quantity-frequency of alcohol consumption to include some measure of heavier per-occasion drinking[11,13]. The AUDIT does this as the third question asks about the frequency of consuming six or more drinks per occasion (albeit that it has the same limit for males and females in most versions). However the AUDIT does more than just incorporate heavy episodic drinking into the consumption total (namely the AUDIT-C score), thereby taking into account drinkers whose usual quantity and frequency may be light or moderate but who from time to time drink more heavily. In the AUDIT-C, drinkers who regularly consume six or more drinks have this level of consumption counted twice through both the second and third questions, thus amplifying the scoring consequences of heavy drinking.
There is an inherent structure in the AUDIT-C in that the frequency of usual drinking (Q1) sets an upper limit on the frequency of drinking six or more drinks per occasion (Q3). In addition, those with heavy usual consumption (Q2=seven or more drinks per drinking day) must be consuming six or more drinks per occasion (Q3) at the frequency with which they drink (Q1). Such a structure provides justification for investigating patterns of consumption as measured by the AUDIT-C items through a latent class analysis, rather than through a factor analysis on ordinal items. Latent class analysis [14,15] is a method of accounting for the patterns of categorical responses observed across a series of questions (the ‘manifest’ variables) by a small set of underlying or ‘latent’ classes. People in these inferred latent classes respond to the questions in different ways. For example, one latent class may consist of heavy drinkers who are likely to report often drinking large quantities whereas members of another latent class may report drinking infrequently with only small amounts per occasion. Latent class analysis also provides an alternative to guidelines-based-classifications using binging and average consumption, such as those adopted by Caldwell et al. for the 1958 British Birth Cohort Study [16].
There have been several factor analyses of the AUDIT in community samples [17-22], mostly but not all finding a consumption and a problems factor: see list for a summary of this work up to 2007 and analyses of patient samples [23]. As well as earlier work using factor analysis [24], Smith and Shevlin have also carried out a latent class analysis on all ten items of the AUDIT together using national data from a survey in Great Britain, finding six classes differing in consumption levels and problems experienced [25].
The New Zealand Mental Health Survey [26,27] provides a large national dataset within which it is possible to investigate patterns of alcohol consumption, as measured by the first three items of the AUDIT (the AUDIT-C), and to relate these patterns to responses to the remainder of the AUDIT. Furthermore, because the World Health Organization Composite International Diagnostic Instrument (CIDI 3.0) [28,29] was used, it is possible to relate consumption patterns to diagnoses. The relationship between total AUDIT scores and alcohol diagnoses has already been reported [30] but there have been no previous analyses of individual AUDIT questions from this data.
This paper uses data from the 2003-2004 New Zealand Mental Health Survey to:
1. Investigate patterns of alcohol consumption as indicated by the AUDIT-C data. Latent class analysis is used to ascertain what different groups of drinkers appear to underlie the observed patterns of consumption.
2. Investigate patterns of alcohol problems indicated by the AUDIT problem questions. Again latent class analysis is used to ascertain underlying groups of drinkers based on their reports of problems. Results are used to score the problem questions to use as outcomes.
3. Investigate the prevalence of alcohol problems and 12-month diagnoses in relation to drinking frequency (Q1), stratified by binge frequency (Q3), to separate out apparent effects of these two aspects of alcohol consumption.
4. Compare the screening properties of AUDIT-C scoresand scores based on other combinations of the AUDIT-C questions or the individual questions for the detection ofalcohol problems or diagnoses.
5. Investigate if the relationships between alcohol consumption and alcohol problems or diagnoses differ by age and sex.
Materials and Methods
Ethics approval for the New Zealand Mental Health Survey was obtained from all 14 regional health ethics committees and written informed consent was obtained from each participant. A report to the New Zealand Ministry of Health provides full details of materials and methods [26,31]. Field work was carried out from late 2003 until the end of 2004.
Sample
Participants were selected through a multistage area probability sample of the population aged 16 years or older, living in permanent private dwellings throughout New Zealand. The primary sampling units (PSUs) were “meshblocks,” areas originally containing 40-70 households used for each census of population and dwellings. There were 1,320 meshblocks selected from a total of 38,365. Within each meshblock, households were selected systematically and then one person was selected per household [32].
Interview
Face-to-face interviews were carried out using a laptop computer assisted personal interview (CAPI). The interview consisted of the Composite International Diagnostic Interview (CIDI 3.0)[28]. In addition, half of those who had ever consumed 12 or more drinks in a year were randomly assigned to the AUDIT instead of to the CIDI consumption questions. CIDI alcohol disorder symptom questions were identical for both groups. Only those assigned to the AUDIT who reported drinking in the last year were asked the ten AUDIT questions. The AUDIT was included because the New Zealand Ministry of Health, which uses the AUDIT in health surveys, wanted to know the relationship between AUDIT scores and CIDI alcohol diagnoses.
Before answering consumption questions, participants were provided with a show-card indicating the standard drink equivalents of commonly available spirits, wine and beer beverages, based on a 10 g standard drink.
DSM-IV diagnoses were used. Diagnosis of 12-month alcohol abuse required a lifetime diagnosis plus reports of symptoms in the past 12 months. Similarly, diagnosis of 12-month alcohol dependence required a lifetime diagnosis plus recent symptoms. This paper reports results for 12-month alcohol disorder (abuse or dependence) or 12-month alcohol dependence. In the version of the CIDI interview used in the New Zealand Mental Health Survey the dependence questions were asked only of people who reported that they had ever experienced at least one of the abuse symptoms. This skip past dependence questions, based on an abuse symptom at any time prior to interview, is less restrictive than the skip investigated using data from the US National Epidemiologic Survey on Alcohol and Related Conditions (NESARC) [33]. The skip applied to NESARC data required an abuse symptom in the past 12 months in order to diagnose dependence in the past 12 months. The CIDI requirement only for an abuse symptom at any time will have had a much more limited impact on prevalence estimates than the NESARC skip.
Statistical methods
All estimates were weighted according to study design variables with adjustment for non-response and post-stratification to the 2001 Census of Population and Dwellings by age, sex and ethnicity. Because of the complex survey design, Taylor Series Linearization was used to produce estimates, taking account of stratification, clustering and weighting. SUDAAN 10.0 [34] was used for crosstabulation, including Cochran-Mantel-Haenszel tests for trend, and logistic regression. Tests for trend are reported as Wald F values with DF=(1, >100); DF (denominator) = number of PSUs with relevant observations (1268) minus number of survey strata (2). Predicted marginal risk ratios (model-adjusted risk ratios) were reported from logistic regression instead of odds ratios [35,36]. Risk ratios and odds ratios are close for uncommon outcomes but for more common outcomes odds ratios are more extreme than risk ratios. As analyses were carried out for outcomes which varied in prevalence, risk ratios were used instead of odds ratios to avoid presenting results which might appear to show larger effects for more common outcomes purely because of their higher prevalence.
Latent class analysis was used to obtain groupings of past-year drinkers based on responses to consumption questions (AUDIT-C questions), and groupings based on reports of alcohol problems (AUDIT questions Q4-Q10). These analyses were carried out using Mplus 6.11 [37], which also takes account of the complex survey design. There was negligible missing data on the AUDIT. Out of 4,823 respondents, 8 respondents missed one question each and 1 missed three questions. Question 8 had the highest number of missing responses (5). Hence Mplus assignment to latent classes was used for all who were allocated to the AUDIT.
Screening tests are assessed using measures of sensitivity and specificity. For a given outcome such as 12-month alcohol disorder, sensitivity is the proportion of people positive for the outcome whose score on the test is at or above a particular cut point, such as a score of ≥5 on the AUDIT-C. Specificity is the proportion of people negative for the outcome who score below the cut point on the test. Sensitivity can be thought of as the hit rate whereas 1-specificity is the false alarm rate. A Receiver Operating Characteristic Curve (ROC curve) joins the points defined by sensitivity and 1-specificity for all possible cut points on the screening test. The line joining the points (0,0) and (1,1) is the line indicating a test of no use at all, as the hit rate always equals the false alarm rate. The nearer the ROC curve is to the (1,0) corner, the higher the sensitivity is for a given 1-specificity and the more useful the test. The Area Under the Receiver Operating Curve (AUROC) provides an overall summary of the performance of a test. Nonparametric Mann-Whitney U estimates were used to calculate AUROC values. SAS 9.3 was used for ROC curves and their comparisons. For these comparisons significance of p<.001 was set, after calculation of design weights for sensitivities. No other adjustment for the complex survey was possible. Estimates were weighted and comparisons took account of multiple curves from the same dataset. Scores based on AUDIT-C variables were entered as numerical variables in ROC analyses. If they were entered as categorical predictors, SAS would reorder them by the probability of the outcome. If there was any non-monotonicity between predictor and outcome then erroneous values for the AUROC would be produced.
Results
The New Zealand Mental Health Survey had an overall response rate of 73.3% [27], resulting in a sample of 12,992, aged 16 years or more. Everyone was asked at what age they had ever had a drink of alcohol, and if they had done so, they were then asked if they had ever consumed 12 or more drinks in a year. Those who had ever consumed this amount were randomly allocated to the AUDIT questions (5,408) or to the CIDI consumption questions (5,383). Of those allocated to the AUDIT, the 4,823 who reported that they had consumed alcohol in the past 12 months were asked the ten AUDIT questions.
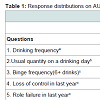
Table 1 shows the distribution of responses on the ten AUDIT questions by past-year drinkers. The drinking frequency question (Q1) had the widest spread of responses and the lowest correlation with the total AUDIT score (r = 0.37). The question about morning drinking had the lowest percentage of positive responses and the second lowest correlation with the AUDIT total (0.39). The frequency of ‘binge’ drinking (six or more drinks per occasion) had the highest correlation with the AUDIT total score (0.76).
Latent class analysis of AUDIT consumption questions (Q1-3)
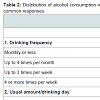
This analysis was carried out to see how many classes of drinkers appeared to underlie the observed patterns of responses across the AUDIT-C consumption questions, and to see the patterns associated with each class. A five class solution was selected, after consideration of the fit indices (Supplementary Table 1), and examination of sources of fit problems.
Interpretation of the five consumption latent classes comes from Table 2. Nearly half of past year drinkers were classified into Consumption-LC1; these drinkers varied in the frequency of their drinking but most usually consumed only 1-2 drinks and never or seldom binged. Consumption-LC5, the heaviest drinking group, drank several times a month to several times a week, always consumed at least 5 drinks and most commonly 10 or more drinks, and binged weekly, daily or almost daily. In between were three latent classes which clearly did not lie along a single dimension. Consumption-LC3 drank frequently, usually only 1-4 drinks but binged monthly. Consumption-LC2 drank less frequently so binged less than monthly but when they did drink, over half consumed 5 or more drinks. Consumption-LC4 drank less than weekly, usually consumed 5-6 or 10 or more drinks, and all binged monthly.
Scoring AUDIT problem questions (Q4-10)
The standard scoring for the AUDIT is to sum the scores from each question (see Table 1) so this procedure can be applied to the Problem questions. However it is possible that drinkers may be better classified by the sets of problems they experience than by the frequency with which they experience problems. Latent class analysis was used to investigate this classification issue and then AUDIT problem scores were compared with the latent classes obtained to provide a scoring system suitable to use for alcohol problem outcomes.
A solution with three latent classes was selected (Supplementary Table 2). Although LMR suggested that two classes would be adequate, BIC and Adjusted BIC were at a minimum with four classes. Inspection of the three and four class solutions showed that the four class solution subdivided the smallest class in the three class solution such that the most extreme problem class had only 42 participants assigned to it (0.6%), which was too small a number for further analyses, although possibly of clinical significance.
Problems-LC1 consisted of people who never or seldom experienced any of the AUDIT problems. It comprised 80.1% of the population (65.4% reported no problems at all). Members of Problems-LC2 experienced problems only occasionally (mostly less than monthly) whereas members of Problems-LC3 experienced problems more frequently, with nearly a quarter injured as a result of their drinking in the last year, and over 40% having concern expressed by others in that period. For each of the seven problem questions there was a gradient across the three latent classes (Supplementary Table 3) and the means (and standard deviations) on the AUDIT problem scores, summed over all seven questions, were 0.4 (1.3), 4.5 (3.2) and 12.2 (6.3). These results suggested that such a sum, hereafter called the AUDIT-P, would provide a useful summary of alcohol problems.
Three cut points of varying severity were used for the AUDIT-P.The first, 1+, indicated any problem at all. The second and third cut points were set where there was a change in the majority latent problem class: 3+ was where the change from the ‘never/seldom’ class (Problems-LC1) to the occasional problem class (Problems-LC2) first occurred and 10+ marked the start of a ‘more frequent problems’ (Problems-LC3) majority. These cut points were set without any indication of relationships with AUDIT-C questions or alcohol diagnoses. With three cut points for the AUDIT-P and two levels of CIDI diagnoses (12-month disorder or 12-month dependence), there were a total of five possible ‘outcomes’.
Does usual drinking frequency (Q1) matter?
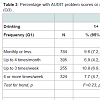
Table 1 indicated that usual drinking frequency (Q1) has little relationship to the AUDIT total score. In addition, the largest latent consumption class contained individuals across the full range of usual drinking frequency, as long as they drank only moderately per drinking day (Q2 and Q3). These findings suggested that perhaps Q1 has little relationship to problems or diagnoses, conditional upon Q3. Table 3 shows that the prevalence of problems or diagnoses depends primarily on Q3, the frequency of drinking six or more drinks per occasion, and is mostly independent of Q1. Nonetheless for drinkers who binge monthly (Q3=1) the trend is for a lower prevalence of alcohol problems (AUDIT-P cut points of 1+ or 3+) among more frequent drinkers (p=.01, .01). In contrast, among drinkers who binge weekly (Q3=3) the opposite trend is seen for alcohol diagnoses (p=.02, .05).
Evaluation of the AUDIT-C, combinations and individual questions as screening instruments
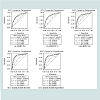
Receiver Operating Characteristic (ROC) curves were calculated to compare the effectiveness of the AUDIT-C and other scores based on the AUDIT-C questions as screening instruments for the detection of alcohol problems and alcohol diagnoses. Figure 1 shows the Receiver Operating Characteristic (ROC) curves for the standard AUDIT-C scoring (Q1+Q2+Q3), (Q2+Q3), and Q3, Q2, and Q1 individually, with their AUROC values. The AUDIT-C, (Q2+Q3) and Q3 alone have ROC curves which are close, indicating that they are approximately all as effective as screening instruments. Their AUROC values differ by no more than 0.02 for any specific outcome. AUROC values for the AUDIT-C range from 0.78 to 0.88 across the outcomes. Drinking frequency (Q1) has much the lowest AUROC whereas usual amount consumed (Q2) is only 0.04 to 0.07 below the highest AUROC across the five outcomes. Drinking frequency (Q1) performs poorly as a screener on its own and does not improve AUROC in combination with Q2 or Q3 or Q2+Q3 (change from -0.08 to +0.03). More detailed comparisons of ROC curves are provided in Supplementary Table 4.
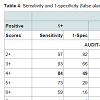
The appropriate cut points to use for screening depend on the condition screened for, the costs and benefits of hits, misses, false alarms and correct rejections as well as on the population being screened. As cut points of 3, 4 and 5 [4] have been suggested for the AUDIT-C these are included in Table 4 which provides estimates of sensitivity and 1-specificity.
Table 4 shows that for any consumption score, sensitivity increases and false alarms (1-specificity) decrease as the prevalence of the outcome decreases (prevalence estimates are provided in Table 3). Although 3+ on the AUDIT-C has been used in some studies, here it produces false alarms of 66% or more for all outcomes. If 80% sensitivity is desired then an AUDIT-C score of 4+ is appropriate for detection of any AUDIT problems (score of 1+), 5+ is appropriate for detecting problem scores of 3+, 6+ for detection of problems scored at 10+, and an AUDIT-C score of 7+ is appropriate for detection of 12-month alcohol disorder or dependence. Sensitivity of around 80% is obtained from (Q2+Q3) with scores of 2+ for detecting any AUDIT problem, 3+ for detecting AUDIT-P 3+, and 4+ is required for the three other outcomes. Any reports of binge drinking (Q3=1) indicate AUDIT-P 1+, albeit with a false alarm rate of 50%, whereas binging at least monthly (Q3=2+) provides sensitivity of around 80% for all other outcomes.
Do relationships between alcohol consumption and problems and diagnoses differ by age and sex?
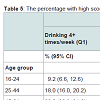
Males were more likely than females to drink several times a week, to consume heavily on a drinking day and to binge more often (Table 5). There was a steep gradient across the age groups for these quantities with the youngest age group the least likely to drink several times a week but the most likely to consume heavily and to binge more frequently (Table 5). Hence there were age and sex differences on the composite measures.
There were also age and sex differences in the prevalence of the five outcomes. 42.0% (39.5, 44.6) of males and only 26.5% (24.5, 28.7) of females had an AUDIT problem score of one or more, while 5.7% (4.6, 7.1) of males met criteria for 12-month alcohol disorder compared with 2.2% (1.7, 2.9) of females. Age differences were even more marked. Among 16-24 year olds 60.4% (55.2, 65.4) had an AUDIT problem score of one or more but only 8.0% of those aged 65 or more had such a score. For 12-month alcohol disorder the prevalence for these two age groups was 10.4% (7.9, 13.5) and 0.1% (0.0, 0.6). No 12-month alcohol dependence was observed in the oldest age group.
In spite of the age and sex differences in consumption and outcomes the AUROC values were close for males and females and also differed only a little by age group. Drinking frequency (Q1) had a somewhat higher AUROC for 16-24 year olds than for the other age groups across all five outcomes. For example, for an AUDIT problem score of one or more, the AUROC values across the four age groups were: 0.69, 0.59, 0.63 and 0.66.
Nonetheless similar AUROC values conceal differences in the optimal cut-point for males and females, and for age groups. For example, if sensitivity of around 80% is required, then for detection of any problem on the AUDIT, a cutpoint of 5+ on the AUDIT-C is required for males (sensitivity 79%, 1-specificity 39%) whereas 4+ is appropriate for females (sensitivity 78%, 1-specificity 43%).Similarly for detection of 12-month alcohol disorder a cutpoint of 7+ is required for males (sensitivity 86%, 1-specificity 24%) whereas 6+ is appropriate for females (sensitivity 85%, 1-specificity 20%). Similar trends were shown across age groups but not so clearly indicating a change in cut-point (tables available on request).
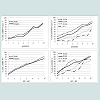
Logistic regression models were used to predict each outcome from age group, sex and consumption measures (AUDIT-C or Q2Q3 or Q3). Full models were run for two outcomes (AUDIT-P 1+ and AUDIT-P 3+). The oldest age group was omitted from other models because of very low outcome prevalences. [Figure 2] shows for males and females and for each age group the percentage with at least one AUDIT Problem (AUDIT-P=1+) for each score on the AUDIT-C, (Q2+Q3) or Q3. This figure shows that for most consumption scores males were slightly more likely than females to experience at least one problem whereas age differences were much more consistent, with the percentage with a problem decreasing with age. Sex and age trends were similar for other outcomes.
All three consumption measures remained strong and highly significant predictors (p≤.0001) of all five outcomes even with age group and sex in the models (tables available on request). Males were more likely than females to have problems or disorder with risk ratios ranging from 1.2 to 1.8, which were not always significant. There was a consistent decline in outcome prevalence from the youngest to the oldest age group for all models. For example, for the AUDIT 3+ outcome, with AUDIT-C as the consumption measure and the age group 25-44 years as the reference group, the risk ratios from youngest to oldest age groups were 1.4, 1.0, 0.6, 0.3, p<.0001.
Discussion
The results presented in this paper from the New Zealand Mental Health Survey (NZMHS) demonstrate that drinking frequency in the past year correlates poorly with the total AUDIT score, varies within the largest latent class of drinkers who are otherwise similar in the amount consumed per occasion, is largely unrelated to alcohol problems or diagnoses when binge drinking frequency is taken into account, and is of little use as a screener. Drinking frequency is a poor indicator of alcohol problems or alcohol diagnoses in the past year. Findings from drinking cultures as different as Switzerland [20] and Sweden [17] as well as in nine European countries [38] support this conclusion. Many people who drink frequently drink only small quantities per occasion. Consequently the NZMHS results show that the AUDIT-C is no better and perhaps slightly worse as a screener than the sum of usual amount plus the frequency of ‘binges’ (6+ drinks per occasion). Binge frequency alone is nearly as good a screener as the AUDIT-C, as also found by Bush and Bernards [18,39]. Binge frequency has also been found useful as a first question to determine whether or not further questioning should occur [8] and is found as one of the items in most alternative short versions of the AUDIT: the AUDIT-C, the AUDIT-3 (Q3 alone), the AUDIT-4 [4]. A recent meta-analysis [40] indicated that a question about binge drinking was the most successful screening question although additional questions were required for adequate sensitivity and specificity.
Even so there are several reasons for assessing drinking frequency. The most important is that the amount of alcohol consumed per unit time requires this information, and volume as well as patterns of drinking behaviour are predictive of physical consequences [41-43].In addition, drinking frequency is a non-threatening first question with negligible non-response. For clinicians dealing with individuals and for those concerned about populations it is one of the most basic aspects of drinking behaviour to ascertain.
Formerly suggested cut points for the AUDIT-C have been 2+ to 5+ [4,44] but 5+ is what is generally used for community samples [4]. The NZMHS has found that even 5+ is too low for detection of multiple problems or alcohol diagnoses. Lower cut points have been suggested for women [4,10] and the NZMHS data supports a reduction of one score. Age differences were also shown in NZMHS, as found by Rubinsky et al., but did not indicate a need to change cut points [45]. Younger drinkers report more negative consequences for the same consumption score. This may relate to other aspects of their drinking and their behaviour. It may also reflect limitations in the AUDIT questions. The maximum category for usual amount consumed is 10 or more drinks so this item does not discriminate among heavy drinkers: for example those who consume 10 drinks and those who consume 20 drinks. Similarly the frequency of drinking six or more drinks per occasion does not differentiate between higher quantities such as six drinks or ten drinks. What is perhaps surprising is just how predictive these three AUDIT questions about alcohol consumption are.
Advantages of this study are that it uses data from a large, nationally representative sample with an acceptable response rate, in which alcohol consumption, problems and diagnoses were measured. A variety of types of analyses were carried out. Nonetheless the data used is cross-sectional and cannot indicate the long-term consequences of drinking. Other limitations relate to what was measured. Only frequency and quantity were assessed, not the context of drinking such as location, company and whether or not drinking was with meals. Another measurement limitation is that the negative consequences of alcohol were measured only through the psychiatric diagnoses of alcohol abuse or dependence, or the AUDIT problem questions which were selected to predict abuse or dependence [3]. The only physical consequence measured was injury due to drinking (AUDIT Q9).
The WHO has classified New Zealand as having a drinking pattern of 2.0 (some heavy drinking), along with most other English speaking countries (Australia, Canada, UK, USA). These countries also have mid-range per capita consumption and a non-trivial minority who are past-year abstainers [46] (Tables 1-3). Therefore the results from the NZMHS would be expected to be broadly applicable to these other countries. They may also apply to countries with mainly regular low volume consumption, as in Spain, although perhaps not to those with infrequent heavy consumption as in Mexico.
In summary, this study shows usual amount of alcohol usually consumed and the frequency of heavy per-occasion drinking in the past year are useful as screening questions for alcohol problems or alcohol diagnoses in that period. However, the frequency of consuming alcohol per se is of little use in such screening.
References
- APA (1994) Diagnostic and statistical manual of mental disorders (DSM-IV) (4th edn.). Washington, DC: American Psychiatric Association.
- WHO (2004) ICD-10: International statistical classification of diseases and related health problems: tenth revision (2nd edn.). Geneva: World Health Organization.
- Saunders JB, Aasland OG, Babor TF, de la Fuente JR, Grant M (1993) Development of the Alcohol Use Disorders Identification Test (AUDIT): WHO collaborative project on early detection of persons with harmful alcohol consumption--II. Addiction 88: 791-804.
- Reinert DF, Allen JP (2007) The alcohol use disorders identification test: an update of research findings. Alcohol Clin Exp Res 31: 185-199.
- Reinert DF, Allen JP (2002) The Alcohol Use Disorders Identification Test (AUDIT): a review of recent research. Alcohol Clin Exp Res 26: 272-279.
- Allen JP, Litten RZ, Fertig JB, Babor T (1997) A review of research on the Alcohol Use Disorders Identification Test (AUDIT). Alcohol Clin Exp Res 21: 613-619.
- Canagasaby A, Vinson DC (2005) Screening for hazardous or harmful drinking using one or two quantity-frequency questions. Alcohol Alcohol 40: 208-213.
- Hodgson R, Alwyn T, John B, Thom B, Smith A (2002) The FAST alcohol screening test. Alcohol Alcohol 37: 61-66.
- McCambridge JIM, Thomas BA (2009) Short forms of the AUDIT in a Web-based study of young drinkers. Drug Alcohol Rev 28: 18-24.
- Dawson DA, Grant BF, Stinson FS, Zhou Y (2005) Effectiveness of the derived Alcohol Use Disorders Identification Test (AUDIT-C) in screening for alcohol use disorders and risk drinking in the US general population. Alcohol ClinExp Res 29: 844-854.
- Greenfield TK, Kerr WC (2008) Alcohol measurement methodology in epidemiology: recent advances and opportunities. Addiction 103: 1082-1099.
- Rehm J, Taylor B, Patra J (2006) Volume of alcohol consumption, patterns of drinking and burden of disease in the European region 2002. Addiction 101: 1086-1095.
- Stockwell T (2001) Harm reduction, drinking patterns and the NHMRC drinking guidelines. Drug Alcohol Rev 20: 121-129.
- Muthén B, Muthén LK (2000) Integrating person-centered and variable-centered analyses: growth mixture modeling with latent trajectory classes. Alcohol Clin Exp Res 24: 882-891.
- Vermunt JK (2010) Latent class models. In Peterson P, Baker E, McGraw B, editors. International Encyclopedia of Education. Elsevier: Oxford. vol 7.
- Caldwell TM, Rodgers B, Clark C, Jefferis BJ, Stansfeld SA, et al. (2008) Lifecourse socioeconomic predictors of midlife drinking patterns, problems and abstention: findings from the 1958 British Birth Cohort Study. Drug Alcohol Depend 95: 269-278.
- Bergman H, Kallmen H (2002) Alcohol use among Swedes and a psychometric evaluation of the alcohol use disorders identification test. Alcohol Alcohol 37: 245-251.
- Bernards S, Graham K, Demers A, Kairouz S, Wells S (2007) Gender and the assessment of at-risk drinking: evidence from the GENACIS Canada (2004-2005) telephone survey version of the AUDIT. Drug Alcohol Depend 88: 282-290.
- Cook S, De Stavola B, Saburova L, Kiryanov N, Vasiljev M, et al. (2011) Socio-demographic predictors of dimensions of the AUDIT score in a population sample of working-age men in Izhevsk, Russia. Alcohol Alcohol 46: 702-708.
- Gmel G, Heeb JL, Rehm J (2001) Is frequency of drinking an indicator of problem drinking? A psychometric analysis of a modified version of the alcohol use disorders identification test in Switzerland. Drug Alcohol Depend 64: 151-163.
- Lima CT, Freire AC, Silva APB, Teixeira RM, Farrell M, et al. (2005) Concurrent and construct validity of the AUDIT in anurban Brazilian sample. Alcohol Alcohol 40: 584-589.
- Wade D, Varker T, O'Donnell M, Forbes D (2012) Examination of the latent factor structure of the Alcohol Use Disorders Identification Test in two independent trauma patient groups using confirmatory factor analysis. J Subst Abuse Treat 43: 123-128.
- Rist F, Glöckner-Rist A, Demmel R (2009) The Alcohol Use Disorders Identification Test revisited: Establishing its structure using nonlinear factor analysis and identifying subgroups of respondents using latent class factor analysis. Drug Alcohol Depend 100: 71-82.
- Shevlin M, Smith GW (2007) The factor structure and concurrent validity of the alcohol use disorder identification test based on a nationally representative UK sample. Alcohol Alcohol 42: 582-587.
- Smith GW, Shevlin M (2008) Patterns of alcohol consumption and related behaviour in great britain: a latent class analysis of the alcohol use disorder identification test (AUDIT). Alcohol Alcohol 43: 590-594.
- Oakley Browne MA, Wells JE, Scott KM (eds). (2006) Te Rau Hinengaro: the New Zealand Mental Health Survey. Wellington, New Zealand: Ministry of Health.
- Wells JE, Oakley Browne MA, Scott KM, McGee MA, Baxter J, et al. (2006) Te Rau Hinengaro: the New Zealand Mental Health Survey: overview of methods and findings. Aust N Z J Psychiatry 40: 835-844.
- Kessler RC, Ustun B (2004) The World Mental Health (WMH) survey initiative version of the World Health Organization (WHO) Composite International Diagnostic Interview (CIDI). Int J Methods Psychiatr Res 13: 93-121.
- Kessler RC, Ustun TB (2008) The World Health Organization Composite International Diagnostic Interview. In: Kessler RC, Ustun TB, editors. The WHO World Mental Health Surveys: Global perspectives on the epidemiology of mental disorders. New York: Cambridge University Press. vol 1.
- Wells JE (2007) Alcohol use disorders identification test. In Wells JE, Baxter J, Schaaf D, editors. Substance use disorders in Te Rau Hinengaro: The New Zealand Mental Health Survey. Wellington, New Zealand: Alcohol Advisory Council of New Zealand.
- Wells JE, McGee MA, Oakley Browne MA (2006) Methods. In Oakley Browne MA, Wells JE, Scott KM, editors. Te Rau Hinengaro: the New Zealand Mental Health Survey. Wellington, New Zealand: Ministry of Health.
- Kish L (1965) Survey sampling. New York: Wiley, Wiley Classics Library.
- Degenhardt L, Bohnert KM, Anthony JC (2007) Case ascertainment of alcohol dependence in general population surveys: 'gated' versus 'ungated' approaches. Int J Methods Psychiatr Res 16: 111-123.
- Research Triangle Institute (2008) SUDAAN Language Manual, Release 10.0. Research Triangle Institute Park, NC: Research Triangle Institute.
- Bieler GS, Brown GG, Williams RL, Brogan DJ (2010) Estimating model-adjusted risks, risk differences, and risk ratios from complex survey data. Am J Epidemiol 171: 618-623.
- Graubard BI, Korn EL (1999) Predictive margins with survey data. Biometrics 55: 652-659.
- Muthén LK, Muthén BO (1998-2010) Mplus user's guide. (Sixth edn.). Los Angeles, CA: Muthén & Muthén.
- Knibbe RA, Derickx M, Kuntsche S, Grittner U, Bloomfield K (2006) A comparison of the Alcohol Use Disorder Identification Test (AUDIT) in general population surveys in nine European countries. Alcohol Alcohol 41: i19-i25.
- Bush K, Kivlahan DR, McDonell MB, Fihn SD, Bradley KA (1998) The AUDIT alcohol consumption questions (AUDIT-C): an effective brief screening test for problem drinking. Arch Intern Med 158: 1789-1795.
- Mitchell AJ, Bird V, Rizzo M, Hussain S, Meader N (2014) Accuracy of one or two simple questions to identify alcohol-use disorder in primary care: a meta-analysis. Br J Gen Pract 64: e408-e418.
- Connor J, Kydd R, Shield K, Rehm J (2013) Alcohol-attributable burden of disease and injury in New Zealand: 2004 and 2007. Wellington, New Zealand: Health Promotion Agency.
- Connor J, Kydd R, Shield K, Rehm J (2015) The burden of disease and injury attributable to alcohol in New Zealanders under 80 years of age: marked disparities by ethnicity and sex. N Z Med J 128: 15-28.
- Rehm J, Sempos CT, Trevisan M (2003) Alcohol and cardiovascular disease--more than one paradox to consider. Average volume of alcohol consumption, patterns of drinking and risk of coronary heart disease--a review. J Cardiovasc Risk 10: 15-20.
- Gomez A, Conde A, Santana JM, Jorrin A (2005) Diagnostic usefulness of brief versions of Alcohol Use Disorders Identification Test (AUDIT) for detecting hazardous drinkers in primary care settings. J Stud Alcohol 66: 305-308.
- Rubinsky AD, Dawson DA, Williams EC, Kivlahan DR, Bradley KA (2013) AUDIT-C scores as a scaled marker of mean daily drinking, alcohol use disorder severity, and probability of alcohol dependence in a U.S. general population sample of drinkers. Alcohol Clin Exp Res 37: 1380-1390.
- Rehm J, Room R, Monteiro M, Gmel G, Graham K, et al. (2004) Alcohol use. In Ezzati M, Lopez AD, Rodgers A, Murray CJL,editors. Comparative Quantification of Health Risks: Global and Regional Burden of Disease Attributable to Selected Major Risk Factors (2nd edn.). Geneva: World Health Organization. Vol 1


