Journal of Plant Biology & Soil Health
Download PDF
Research Article
*Address for Correspondence: Uttam Kumar Sahoo, Department of Forestry, Mizoram University, Tanhril, Aizawl, Mizoram - 796004, India, Tel/Fax: 86-21-57762652; E-mail: uksahoo_2003@rediffmail.com
Citation: Thong P, Pebam R, Sahoo UK. Recovery Pattern of Vegetation during Succession Following Slash and Burn Agriculture in Mizoram, North-East India. J Plant Biol Soil Health. 2016;3(2): 8.
Copyright © 2016 Thong P, et al. This is an open access article distributed under the Creative Commons Attribution License, which permits unrestricted use, distribution, and reproduction in any medium, provided the original work is properly cited.
Journal of Plant Biology & Soil Health | ISSN: 2331-8996 | Volume: 3, Issue: 2
Submission: 03 October, 2016 | Accepted: 15 November, 2016 | Published: 24 November, 2016
Recovery Pattern of Vegetation during Succession Following Slash and Burn Agriculture in Mizoram, North-East India
Pentile Thong1, Rocky Pebam 2 and Uttam Kumar Sahoo1*
- 1Department of Forestry, Mizoram University, Tanhril, Aizawl, Mizoram, India
- 2North-Eastern Space Applications Centre, Umiam, Meghalaya, India
*Address for Correspondence: Uttam Kumar Sahoo, Department of Forestry, Mizoram University, Tanhril, Aizawl, Mizoram - 796004, India, Tel/Fax: 86-21-57762652; E-mail: uksahoo_2003@rediffmail.com
Citation: Thong P, Pebam R, Sahoo UK. Recovery Pattern of Vegetation during Succession Following Slash and Burn Agriculture in Mizoram, North-East India. J Plant Biol Soil Health. 2016;3(2): 8.
Copyright © 2016 Thong P, et al. This is an open access article distributed under the Creative Commons Attribution License, which permits unrestricted use, distribution, and reproduction in any medium, provided the original work is properly cited.
Journal of Plant Biology & Soil Health | ISSN: 2331-8996 | Volume: 3, Issue: 2
Submission: 03 October, 2016 | Accepted: 15 November, 2016 | Published: 24 November, 2016
Abstract
The recovery of forest after shifting cultivation (locally known as ‘jhum’) has multiple complications as observed in various forest types, disturbed regimes, climate conditions and so forth. Rate of recovery and species composition are of major concern to understand the process of succession. The present study was carried out in Champhai district of Mizoram, India with the aim to comprehend the recovery of vegetation at different stages of succession after abandonment. Jhum fields of 5, 10, 15 and 25 fallow ages were located from the satellite imagery and the plot was navigated using GPS. Quadrats were randomly laid within those plots and the plants were enumerated and analysed. The species were contiguously distributed. Ecological indices indicated high diversity and species richness for tree and shrub components but low diversity and species richness for herbaceous component. The number of tree species declined by 5.1% from 5 years fallow to 10 years fallow. However, it increases from 10 years to 15 years fallow by 8.1% and was further enhanced to 32.5% on 25 years fallow. It was also observed that the number of shrub species declined from 5 years to 10 years fallow by 4.9% which worsened to 15.4% on 15 years fallow. Nevertheless, there was a distinct rise in the number of species on the 25 years fallow by 54.6%. Interestingly, the number of herbaceous species was observed to decrease from 5 years to 10 years fallow by 6.8% and further declined by 2.4% and 17.5% on 15 years and 25 years fallow, respectively. Therefore, the percent recovery of tree and shrub species from 5 years to 25 years fallow was 35.9% and 24.4%, respectively, while 25.0% of herb species declined during the same fallow period.Keywords
Shifting cultivation; Succession; Fallow age; Quadrats; Ecological indices; Recovery percentageIntroduction
Slash and burn agriculture or shifting cultivation is the predominant and primitive agriculture in the hills of Northeast India, wherein settled cultivation constitutes only a small portion of the total cultivated land mostly confined to the valley areas. This agriculture involves the cutting of forest followed by burning of the plant material. When the soil loses its fertility and crop productivity becomes meagre the farmer shifts to another piece of virgin or secondary forest for cultivation, leaving the abandoned land to regenerate naturally during the fallow period. The farmer then returns back again to the same piece of land for cultivation after a certain period of cropping and fallow depending on ethnicity, population and land ratio [1].A series of disturbances that the slash and burn agriculture constitute such as cutting, burning and weeding have dramatic effects on the mortality and regeneration of plant species [2]. The combine effect of each of these events may reduce or eliminate the potential for on-site species regeneration, leaving seed dispersal as the major way for establishing of species from the nearby forest.
The rate of recovery in species diversity, species richness, basal area and species density are influenced by the climatic conditions. Studies have shown that the rate of recovery is higher in the humid and moist tropics, whereas regeneration to restore the structure of a mature forest is faster in the dry tropical forest [3]. Vegetation succession following shifting cultivation in tropical regions also indicated that the diversity of woody species gradually increases with fallow age [4-7].
The cropping period as well as jhum cycle affects the vegetation recovery process [2,7]. Studies from tropical rainforest of Madagascar have shown that higher frequency of jhum cycle decreased the richness and abundance of tree seedlings and sapling, and therefore suggested that reducing slash and burn intensity will increase the speed of tree recruitment and fallow recovery [8].
In present scenario, shifting cultivation is considered unsustainable due to decrease in the jhum cycle with the rise in population resulting in very low input-output ratio [1,9,10]. When the jhum cycle drops below a critical time period, the natural regeneration of vegetation is negatively affected [11-13]. The short jhum cycle in Northeast India has resulted in arrested succession where weedy species were not succeeded by pioneer woody species, and over time the soil seed bank is replaced with seeds of weedy shrubs [14].
Since the practice involves a continuous cycle of clear-felling and regeneration, shifting cultivation sites provide an opportunity to understand the secondary succession patterns. However, relatively few studies have examined the recovery pattern of vegetation following shifting cultivation in Northeast India in general and no attempt was done in Mizoram in particular. The present work is an attempt to study the recovery pattern of plant communities during succession following slash and burn agriculture.
Materials and Methods
Site descriptionThe study was undertaken in shifting cultivation areas in Dulte village in Champhai district of the state Mizoram in North-east India located at 23.4454° N, 93.1780° E with an area of 3,185.83 square kilometers. Champhai has a moderate climate with average annual rainfall of 1,814 millimeters. In winter the mean temperature varies from 10 °C to 20 °C and in summer, it ranges from 15 °C to 30 °C.
Data collection
Vegetation analysis were carried out in two replicate sites for fallow aged 5 (J5), 10 (J10), 15 (J15) and 25 (J25) years during the month of January and February. The fallow age of the jhum fields was located from the satellite imagery and the plot was navigated using a GPS. Within each sample plot, ten quadrat of 10 × 10 m, fifteen quadrat of 3 × 3 m and twenty quadrat of 1 × 1 m were randomly laid for identifying trees, shrubs and herbs respectively. The diameter at breast height (dbh) of trees was measured at 1.3 m height but in case of shrubs and herbs the dbh was measured on the ground level. The heights of all individuals were also measured. Mature trees were defined as stems with > 30 cm girth at breast height (1.3 m) and > 5 m height, poles as individuals > 10 cm to < 30 cm girth and > 2 m height, saplings are individuals > 1 cm to < 10 cm collar girth and > 0.5 m to < 2 m height, seedlings as individuals > 1 cm collar girth and > 0.1 to < 0.5 m height and recruits as individuals > 1 cm collar girth and up to 0.1 m height. All plants were enumerated and analyzed in each sample plot.
The species sampled in the five layers of vegetation were classified into the five growth forms, namely tree, pole, shrub, herb and recruit. All the emergent species were grouped under trees and poles. Shrubs included species that were found in sub-canopy, were shade-loving, prevalent in understory. Bamboo and woody climbers were also considered in shrub category. Herbs and recruits included shadeloving, annual, biennial or perennial, and herbaceous climbingspecies.
Analysis of plant diversity
Analysis of plant diversity was carried out by calculating Shannon Diversity Index (H’), Simpson Dominance Index (C), Pielou’s Evenness Index (J’) and Margalef Species Richness Index (Dmg). These indices were adopted for their low sensitivity to the sample size [15].H’= -Σ pi ln pi where pi is the proportional abundance of species (i.e., number of species divided by total number in the community).C= Σ pi2; where pi is same for Shannon’s index.J’= H’/ ln S where H’ is the number derived from the Shannon diversity index and S is the total number of species.Dmg = (S-1)/ ln N where N is the total number of individuals in the sample and S is the number of species recorded.
Analysis of community structure
Quantitative community characters were studied by determining density, frequency, abundance, basal area and Important Value Index (IVI) of each species in the selected communities following the methods given by Mueller-Dombois and Ellenberg (1974) [16]. Horizontal structure of selected communities was analysed by Whitford Index.
Results
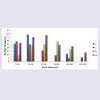
Species richness and abundanceTree Species richness per 0.2 ha increased from 39 species in J5 to 53 species in J25. However, there was a decrease in the number of species in J10 consisting of 37 species. Shrub species richness per 270 m2 was lowest (33) in J15 and highest (51) in J25. However, herbaceous species richness per 40 m2 was highest in J5 (44) showing gradual decrease with age of the fallows with lowest species (33) in J25 (Table 1).
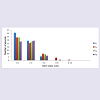
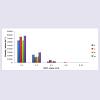
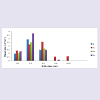
Distribution of tree, shrub and herb species within the different girth classes showed contrasting pattern in all the four fallow ages (Figures 1-3). Number of tree species was highest in the girth class 20 - 40 cm in J5 and decreased gradually in the higher girth classes. Similarly, maximum number of shrub and herb species occurred in the lowest girth class (0 - 15 cm) in J25 and (0 - 2 cm) in J5, respectively. Number of shrub and herb species decreased with the increase in the girth class.
Stratification
The jhum fallow stands showed five strata viz., (i) Tree, (ii) Pole, (iii) Sapling, (iv) Seedling, and (v) Recruit. In each fallow age, the dominant species of each stratum was calculated using Simpson Dominance Index (C). Table 2 represents the dominant species of each stratum in jhum fallows of different ages with C value.Spatial distribution pattern
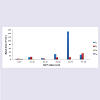
On the jhum fallows, majority of the tree species (85 - 100%), shrub species (98 - 100%) and herb species (100%) showed clumped or contiguous distribution pattern. Very few tree species (1.9 - 15%) and shrub species (2%) showed random distribution pattern but did not show regular distribution pattern. Random and regular distribution pattern was not observed in the herb species at different fallow ages (Figures 4-6). Density
The total stand density of tree species varied considerably among all four fallow ages. The tree species largely contributing to the stand density were Castanopsis tribuloides (Sm.) A.DC. and Scaphium scaphigerum (Wall. ex G. Don) G. Planch. in 5 years fallow, Protium serratum (Wall. ex Colebr.) Engl. and Actinodaphne angustifolia (Nees) Blume in 10 years fallow, Schima wallichii Choisy and Mallotusnudiflorus (L.) Kulju & Welzen in 15 years fallow, and Sapium eugeniaefolium Buch. Ham and Hymenodictyon orixense (Roxb.) Mabb. in 25 years fallow. Density - distribution of tree species in different girth class reveals that the girth class 20 - 40 cm constituted 63.0% in J5, 28.1% in J10, 29.7% in J15 and 37.2% in J25 (Figure 7). In all the four fallows, the percentage contribution to the total stand density decreased with the increasing girth class, except there is increased from girth class 0 - 20 cm to 20 - 40 cm.The shrub species largely contributing to the stand density were Thysanolaena latifolia (Roxb. ex Hornem.) Honda and Bambusa tulda Roxb. in 5 years fallow, Dendrocalamus hookeri Munro and Imperata cylindrical (L.) Raeusch. in 10 years fallow, Chromolaena odorata (L.) RM King & H Rob and Seneci cappa Buch.-Ham. ex D.Don in 15 years fallow, and Urena lobata Linn. and Chromolaena odorata in 25 years fallow. Density - distribution of shrub species in different girth class reveals that the lowest girth class (0 - 15 cm) constituted 42% in J5, 78.4% in J10, 98.6% in J15 and 99.4% in J25 (Figure 8). In all the four fallows, the percentage contribution to the total stand density does not follow a pattern but fluctuates with increasing girth class.The herb species largely contributing to the stand density were Pteris quadriaurita Retz. and Polygonum chinensis Linn. in 5 years fallow, Dichrocephala integrifolia (L.f.) Kuntze and Gynura bicolour (Roxb. Ex Willd.) DC. in 10 years fallow, Molineria capitulate (Lour.) Herb. and Ageratum conyzoides (L.) L. in 15 years fallow, and Mikania micrantha Kunth and Dicranopteris linearis (Burm.f.) Underw. in 25 years fallow. Density - distribution of herb species in different girth class reveals that the lowest girth class (0 - 2 cm) constituted 70.4% in J5, 74.2% in J10, 73.7% in J15 and 69.4% in J25 (Figure 9). In all the four fallows, the percentage contribution to the total stand density decreased with the increasing girth class.Basal area
Basal area has been shown to be an important predictor of successional changes [17]. Basal cover of the tree species differed considerably in the four fallows, from 8.44 m2 ha-1 in J5 to 33.75 m2 ha-1 in J25 (Table 1). The highest basal area was found in Sapium eugeniaefolium covering 2.85 m2 ha-1 on 25 years fallow and lowest was found in Vaccinium sprengelii (G. Don) Sleumer covering 0.00045 m2 ha-1 on 5 years fallow. The distribution of basal area in different girth classes revealed that trees in girth class 80 - 100 cm contributed maximum to the basal cover of 31.3% (Figure 10). In shrubs, the highest basal area was found in Dendrocalamus hookeri covering 41.74 m2 ha-1 on 5 years fallow and lowest was found in Meizotropis buteiformis Voigt covering 0.000037 m2 ha-1 on 25 years fallow. The distribution of basal area in different girth classes revealed that shrubs in girth class 60 - 75 cm contributed maximum to the basal cover of 51.2% (Figure 11). In herbs, the highest basal area was found in Eulalia trispicata (Schult.) Henrard covering 1.14 m2 ha-1 on 10 years fallow and lowest was found in Molineria capitulate covering 0.00075 m2 ha-1 on 5 years fallow. The distribution of basal area in different girth classes revealed that herbs in girth class 2 - 4 cm contributed maximum to the basal cover of 46.3% (Figure 12).
Dominance
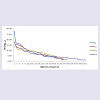
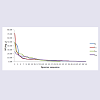
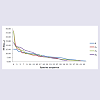
The jhum fallows showed altogether different patterns of dominance based on the IVI values of the tree, shrub and herb species. In 5 years fallow, Castanopsis tribuloides (IVI 27.64) was the dominant tree species and Scaphiums caphigerum (IVI 17.85) and Magnolia pleiocarpa (Dandy) Figlar & Noot. (IVI 16.33) were the co-dominant tree species. In 10 years fallow, Dysoxylum excelsum Blume (IVI 17.37) was the dominant tree species and Actinodaphne angustifoliac (IVI 15.52) and Hibiscus macrophyllus Roxb. ex Hornem. (IVI 15.48) were the co-dominant tree species. In 15 years fallow, Schima wallichii (IVI 14.29) was the dominant tree species and Persea odoratissima (Nees) Kosterm. (IVI 13.66) and Engelhardtia spicata Lechen ex Blume (IVI 12.05) were the co-dominant tree species. In 25 years fallow, Sapium eugeniaefolium (IVI 17.87) was the dominant tree species and Hymenodictyon orixense (IVI 15.04) and Tectona grandis Linn (IVI 12.87) were the co-dominant tree species (Figure 13).Among the shrub species in 5 years fallow, Thysanolaena latifolia showed the highest value of IVI (45.80) followed by Dendrocalamus hookeri (IVI 45.09) and Melocanna baccifera (Roxb.) Kurz (IVI 14.15). In 10 years fallow, Dendrocalamus hookeri showed the highest value of IVI (71.73) followed by Bambusa longispiculata Gamble (IVI 28.95) and Imperata cylindrical (IVI 21.40). In 15 years fallow, Thysanolaena latifolia showed the highest value of IVI (49.15) followed by Senecio cappa (IVI 24.51) and Flueggea virosa (Roxb. ex Willd.) Royle (IVI 23.23). And, in 25 years fallow, Thysanolaena latifolia again showed the highest value of IVI (25.15) followed by Chromolaena odorata (IVI 19.41) and Urena lobata (IVI 18.60) (Figure 14).In 5 years fallow, the herbaceous component was dominated by Pteris quadriaurita (IVI 15.41), Polygonum chinensis (IVI 15.31) and Eragrostis nutans (Retz.) Nees ex Steud (IVI 15.04). In 10 years fallow, the herbaceous component was dominated by Eulalia trispicata (IVI 37.55), Dichrocephala integrifolia (IVI 22.32) and Dicranopteris linearis (IVI 16.09). In 15 years fallow, the herbaceous component was dominated by Eulalia trispicata (IVI 36.98), Molineria capitulate (IVI 18.53) and Amaranthus spinosus Linn. (IVI 17.64). In 25 years fallow, the herbaceous component was dominated by Dicranopteris linearis (IVI 23.43), Galinsoga parviflora Cav. (IVI 19.99) and Mikania micrantha (IVI 18.73) (Figure 15).In general, the dominance-distribution curves for tree, shrub and herb components for all the four fallow ages showed lognormal distribution which is a feature of species-rich community [15,18).
Ecological diversity
Trees and shrubs showed increasing trend for Shannon Diversity Index and Margalef Species Richness Index but Pielou’s Evenness Index decreases in trees and increase in shrubs with the increase in the fallow age. These indices indicate high diversity and species richness but the tree component is not equitably distributed while the shrub component is equitably distributed as the fallow age increases. This was also supported by the low values of Simpson Dominance Index. However, the herbaceous component showed decreasing trend for Shannon Diversity Index, Margalef Species Richness Index and Pielou’s Evenness Index. These indices indicate low diversity, low species richness and inequitable distribution of herb species with the increase in the fallow age.
The number of tree species declined by 5.1% from 5 years fallow to 10 years fallow. However, it increased from 10 years to 15 years fallow by 8.1% and was further enhanced to 32.5% on 25 years fallow. It was also observed that the number of shrub species declined from 5 years to 10 years fallow by 4.9% which worsened to 15.4% on 15 years fallow. Nevertheless, there was a distinct rise in the number of species on the 25 years fallow by 54.6%. Interestingly, the number of herbaceous species was observed to decrease from 5 years to 10 years fallow by 6.8% and further declined by 2.4% and 17.5% on 15 years and 25 years fallow, respectively. Therefore, the percent recovery of tree and shrub species from 5 years to 25 years fallow was 35.9% and 24.4%, respectively, while 25.0% of herb species declined during the same fallow period.
Discussion
Regeneration dynamics of fallow vegetation generally becomes complex illustrating recovery from the preceding shifting cultivation. Grass species or annual herbs may dominate after land abandonment, then other pioneer species are established [2,19,20]. Correspondingly, our results showed that 5 years and 10 years jhum fallow were colonized by herbaceous species mostly seedlings and few recruits. Pteris quadriaurita from family Pteridaceae dominated in 5 years jhum fallow and Eulalia from family Poaceae dominated in 10 years jhum fallow. The 15 years jhum fallow was colonized by tree and herbaceous species. Schima wallichii from family Theaceae and Eulalia trispicata from family Poaceae dominated this fallow age. Also, the 25 years jhum fallow was colonized by tree species and few poles. Sapium eugeniaefolium from family Euphorbiaceae was dominant in this fallow age. This was observed similar to studies reported from the tropical regions that diversity of woody species gradually increases with fallow age [5].Successional sites that recover over long periods may differ compositionally from uncut forest within a shifting cultivation landscape as these forests are often prone to other anthropogenic disturbances [21]. Natural restoration of degraded forest ecosystems to intact forests greatly depends on the establishment ability of tree species [2]. Massive invasion of shrubs into open fallows may be one of the possible causes to hamper the growth of tree seedlings and saplings through competition [22]. Presence of large number of herbaceous species on the young fallows in the present study may be due to the strong competition offered by them to the potential woody pioneer resulting in growth suppression and mortality of the tree seedlings and saplings [23-26].
However, this study showed the increase in the tree and shrub component while the herbaceous component decrease with increase in the fallow of different ages, as shade-intolerant species established in the first year after land abandonment increased with fallow ages [27].
With increasing fallow age, the dominant species in these communities used the major fraction of available resources of the community leaving only a small fraction to be pre-empted by other species, as showed by the dominance-diversity curves of these communities. Community recovery can be accelerated when comparatively large forest area share a border with shifting cultivation site, in comparison with recovery in sites with shorter fallow cycles in the absence of adjoining forests, which act as sources for recolonization of vegetation [28].
Secondary forests after shifting cultivation are substantial carbon sinks and that this capacity to store carbon increases with abandonment age. Allowing development of such secondary regrowth has the potential to mitigate the impacts of deforestation and forest degradation and to contribute to global carbon sequestration [29].
The recovery of forest after shifting cultivation has multiple complications as observed in various forest types, disturbed regimes, climate conditions and so forth. This has challenged the restoration ecologists to seek an appropriate restoration strategy. Requirements on the rate of recovery and the similarity in species composition to the surrounding old growth forest are most important considerations [30]. Furthermore, site and elevation plays a major role in the recovery of forest following shifting cultivation [21].
Acknowledgement
The first author (Pentile Thong) gratefully acknowledges the financial support from Department of Science & Technology, New Delhi in the form of INSPIRE Fellowship (Grant No. DST/INSPIRE Fellowship/2015/IF 150621 dated 11/01/2016). We are also thankful to the Head, Department of Forestry, Mizoram University for providing necessary logistic and laboratory facilities to carry out this work.References
- Tripathi RS, Barik SK (2003) Agricultural engineering and problems and prospects of shifting cultivation: shifting cultivation in North East India. In: Bhatt BP, Verma ND, Sharma YP, Patiram (Eds), Approaches for increasing agricultural productivity in hill and mountain ecosystem. ICAR Research Complex for NEH region, Umiam, Meghalaya, India.
- Uhl C (1987) Factors controlling succession following slash-and-burn agriculture in Amazonia. J Ecol 75: 377-407.
- Kennard DK (2002) Secondary forest succession in a tropical dry forest: patterns of development across a 50-year chronosequence in lowland Bolivia. J Trop Ecol 18: 53-66.
- Lebrija-Trejos E, Bongers F, P´erez-Garc´ia EA, Meave JA (2008) Successional change and resilience of a very dry tropical deciduous forest following shifting agriculture. Biotropica 40: 422-431.
- Van Do T, Osawa A, Thang NT (2010) Recovery process of a mountain forest after shifting cultivation in Northwestern Vietnam. Forest Ecol Manag 259: 1650-1659.
- Fujisaka S, Escobar G, Veneklaas EJ (2000) Weedy fields and forests: interactions between land use and the composition of plant communities in the Peruvian Amazon. Agric Ecosystems Environ 78: 175-186.
- Lawrence D (2004) Erosion of tree diversity during 200 years of shifting cultivation in Bornean rainforest. Ecol Appl 14: 1855-1869.
- Klanderud K, Mbolatiana HZ, Vololomboahangy MN, Radimbison MA, Roger E, et al. (2010) Recovery of plant species richness and composition after slash-and-burn agriculture in a tropical rainforest in Madagascar. Biodivers Conserv 19: 187-204.
- Grogan p, Lalnunmawia F, Tripathi SK (2012) Shifting cultivation in steeply sloped regions: a review of management options and research priorities for Mizoram state, Northeast India. Agrofor Syst 84: 163-177.
- Singh J, Bora IP, Baruah A (2002) Changes in the physic-chemical properties of soil under shifting cultivation with special references to Karbi Anglong district of Assam. Indian J For 26: 116-122.
- Spencer JE (1966) Shifting cultivation in Southeastern Asia. University of California Press, Berkeley, California, USA, pp. 247.
- Ramakrishnan PS (1992) Shifting agriculture and sustainable development: an interdisciplinary study from North-Eastern India. Parthenon Publishing Group, UK, pp. 424.
- Raman TR, Rawat GS, Johnsingh AJ (1998) Recovery of tropical rainforest avifauna in relation to vegetation succession following shifting cultivation in Mizoram, north-east India. J Appl Ecology 35: 214-231.
- Saxena KG, Ramakrishnan PS (1984) Herbaceous vegetation development and weed potential in slash and burn agriculture (jhum) in N.E India. Weed Res 24: 135-142.
- Magurran AE (1988) Ecological diversity and its measurement. Princeton University Press, Princeton, New Jersey, USA, pp. 179.
- Mueller-Dombois D, Ellenberg H (1974) Aims and methods of vegetation ecology. Wiley and Sons, New York, USA, pp. 547.
- Lohbeck M, Poorter L, Paz H, Pla L, Van Breugel M, et al. (2012) Functional diversity changes during tropical forest succession. Perspect Plant Ecol Evol Syst 14: 89-96.
- Whittaker RH (1972) Evolution and measurement of species diversity. Taxon 21: 213-251.
- Ohtsuka T (1999) Early stages of secondary succession on abandoned cropland in north-east Borneo Island Ecol Res 14: 281-290.
- Maki F, Mamoru K, Thien HM, Munn A (2007) Recovery process of fallow vegetation in the traditional Karen swidden cultivation system in the Bago mountain range, Myanmar. Southeast Asian Stud 45: 317-333.
- Teegalapalli K, Datta A (2016) Field to a forest: patterns of forest recovery following shifting cultivation in the Eastern Himalayas. For Ecol Manag 364: 173-182.
- Styger E, Rakotondramasy HM, Pfeffer MJ, Fernandes EC, Bates DM (2007) Influence of slash-and-burn farming on fallow succession and land degradation in the rainforest region of Madagascar. Agric Ecosystems Environ 119: 257-269.
- Kellman M (1980) Geographic patterning in tropical weed communities and early secondary successions. Biotropica 12: 34-39.
- Holl KD, Loik ME, Lin EH, Samuels IA (2000) Tropical montane forest restoration in Costa Rica: overcoming barriers to dispersal and establishment. Restoration Ecol 8: 339-349.
- Ferguson BG, Vandermeer J, Morales H, Griffith DM (2003) Post-agricultural succession in El Petѐn, Guatemala. Conserv Biol 17: 818-828.
- Mishra BP, Tripathi OP, Tripathi RS, Pandey HN (2004) Effects of anthropogenic disturbance on plant diversity and community structure of a scared grove in Meghalaya, north-east India. Biodivers Conserv 13: 421-436.
- Breugel MV, Bongers F, Martinez-Ramos M (2007) Species dynamics during early secondary forest succession: recruitment, mortality and species turnover. Biotropica 39: 610-619.
- Karthik T, Veeraswami GG, Samal PK (2009) Forest recovery following shifting cultivation: an overview of existing research. Trop Conserv Sci 2: 374-387.
- Mukul SA, Herbohn J, Firn J (2016) Tropical secondary forests regenerating after shifting cultivation in the Philippines uplands are important carbon sinks. Sci Rep 6: 22483.
- Tran DV, Osawa A, Nguyen TT (2011) Recovery of vegetation structure and species diversity after shifting cultivation in Northwestern Vietnam, with special reference to commercially valuable tree species. Int Sch Res Notices Ecol 2011: 1-12.


